

MEI
Metabolic Efficiency Index
Identify the Cows That Turn Feed Into Profit.
Two cows can eat the same ration and produce nearly identical milk, yet one is far more profitable than the other. MEI measures the efficiency you can’t see, giving every cow a value beyond the milk tank.
A 0–100 score for how efficiently each cow turns feed into milk.
C-Lock ranks your cows, identifies your best and worst converters, and gives you the hard numbers to make better breeding and management decisions.
More milk per pound of feed. Your most efficient cows.
Less milk per pound of feed. Eating into your margin.
Two Cows. Same Herd. Different Engines.
Two cows can eat the same ration, milk in the same parlor, and look the same in the alley — yet turn that feed into very different amounts of milk. That difference is heritable, and it rides into their daughters. Bulk-tank averages hide it. A per-cow number doesn't.
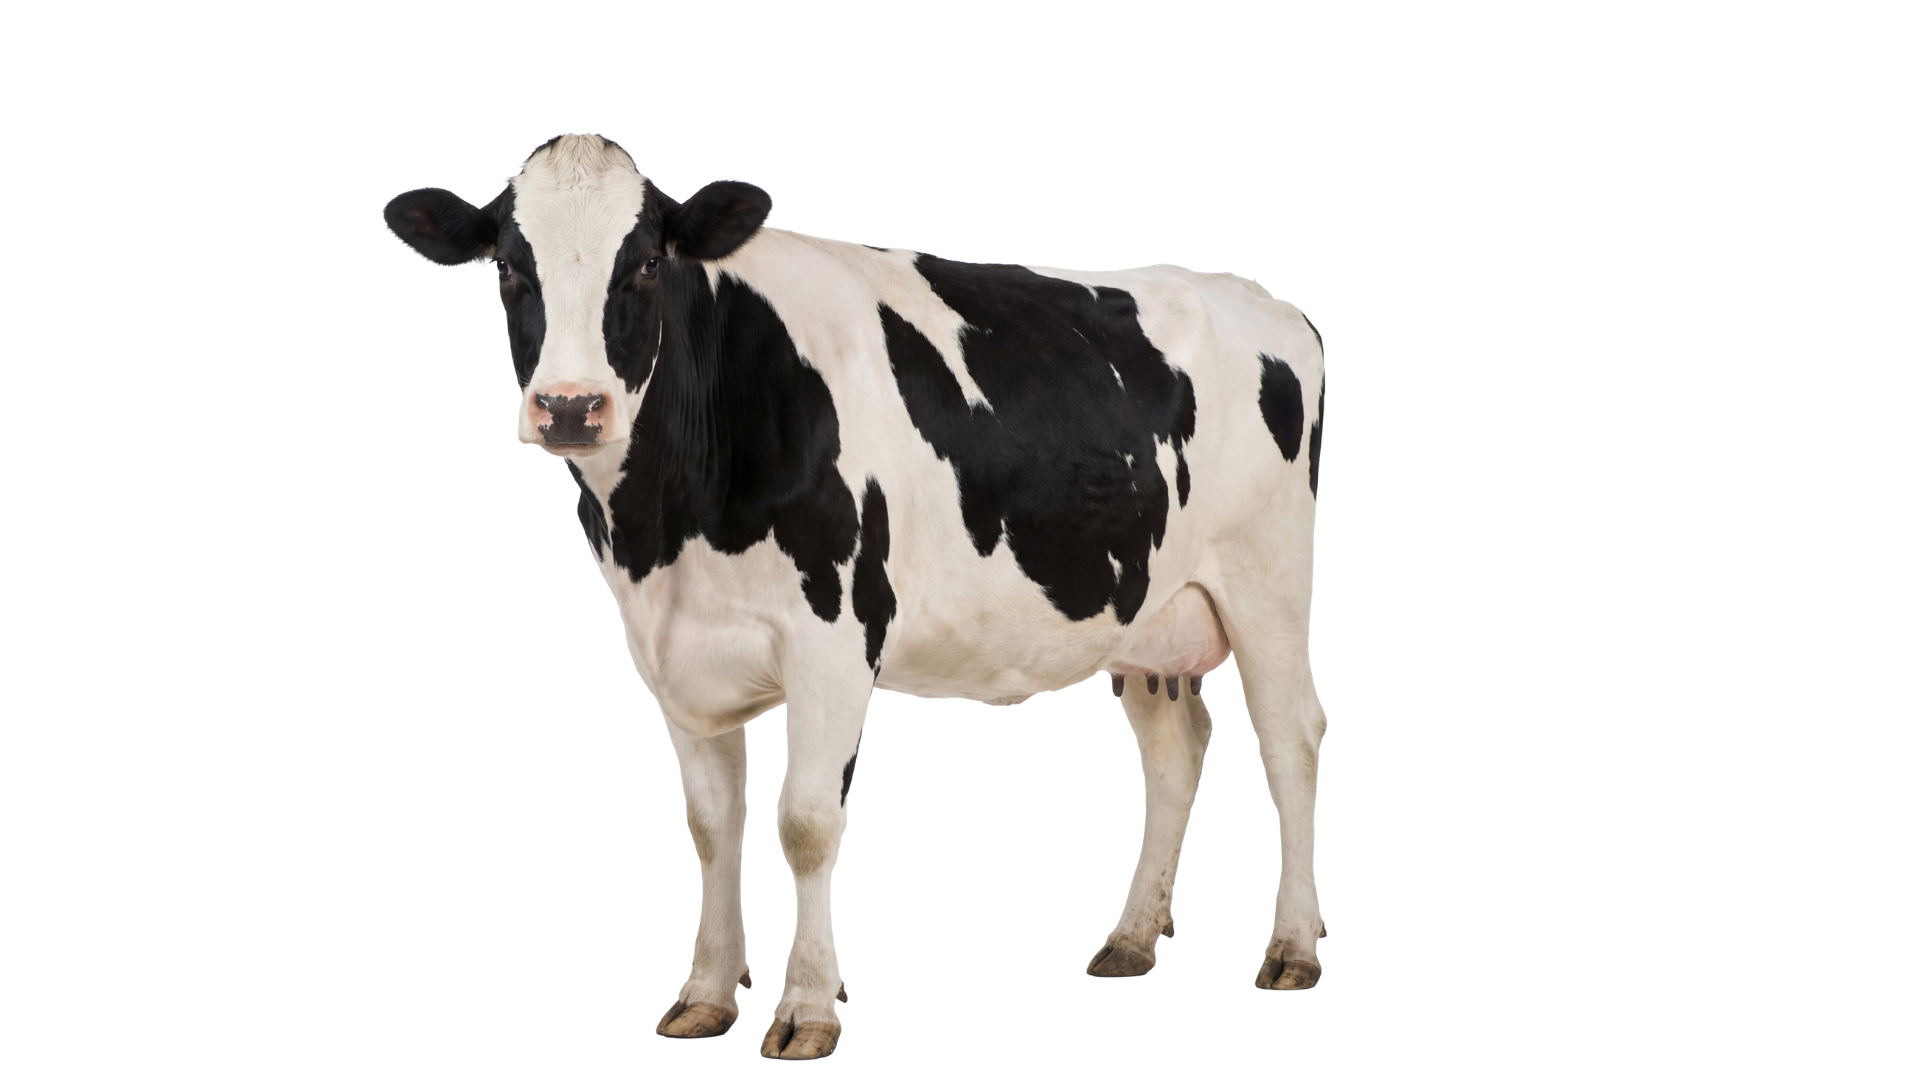
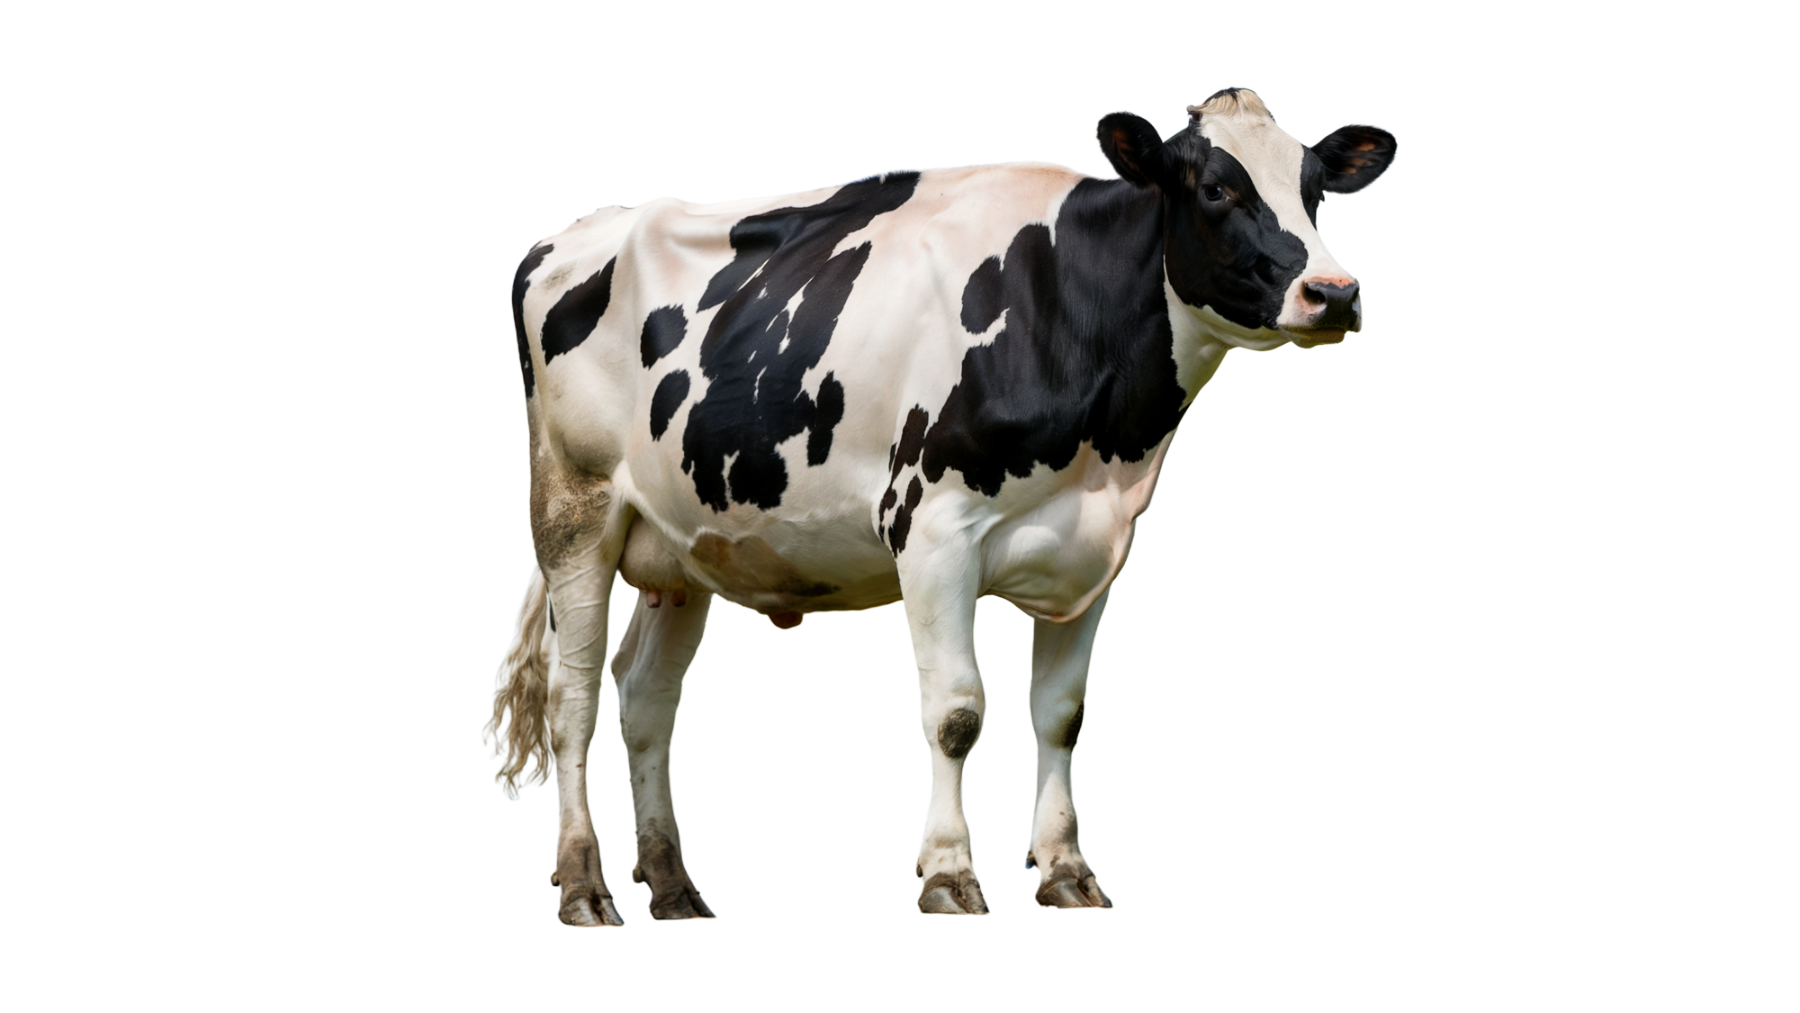
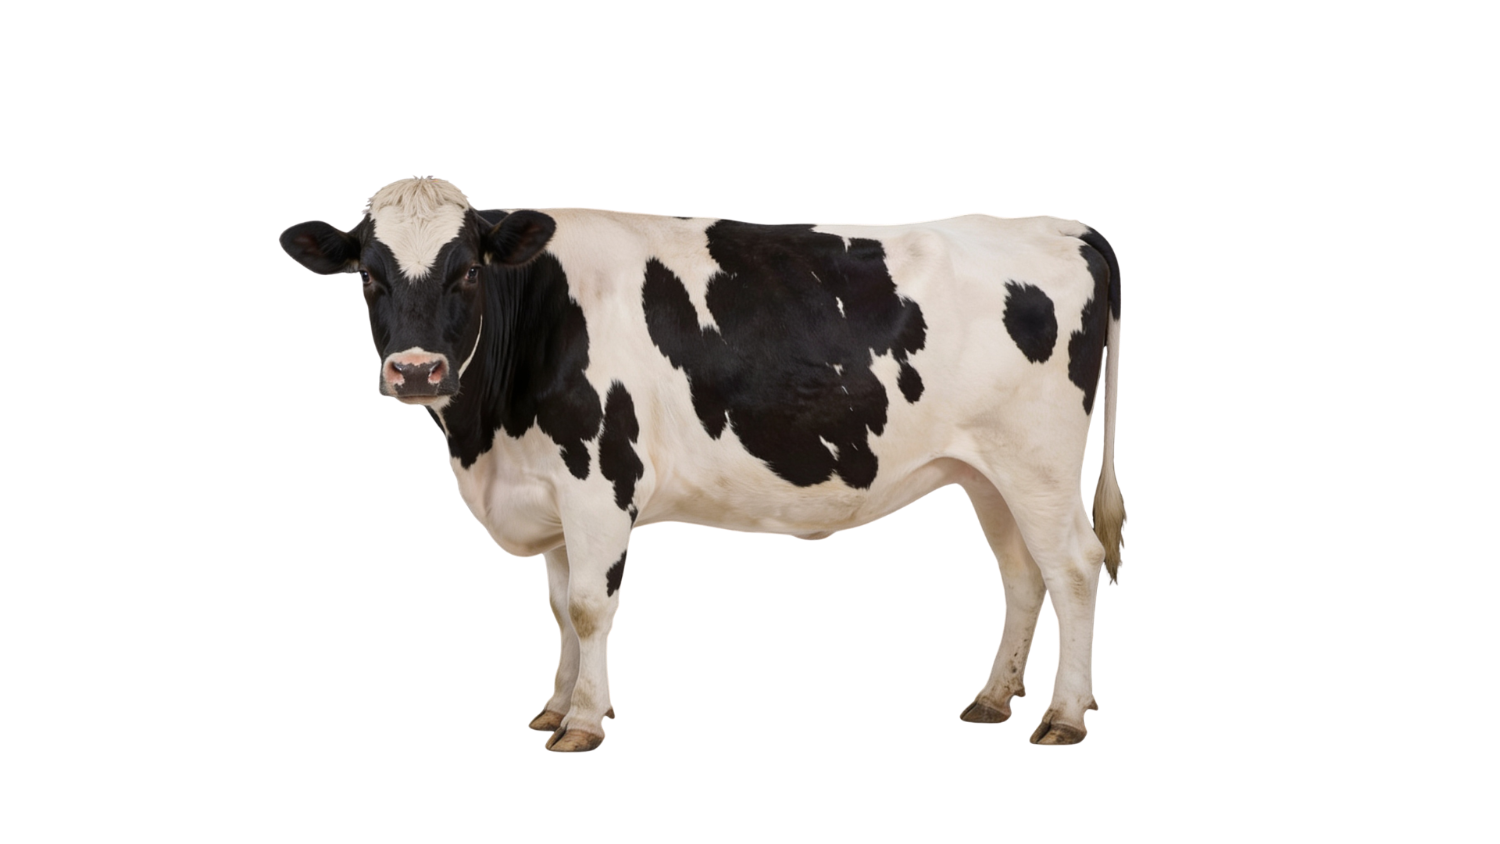
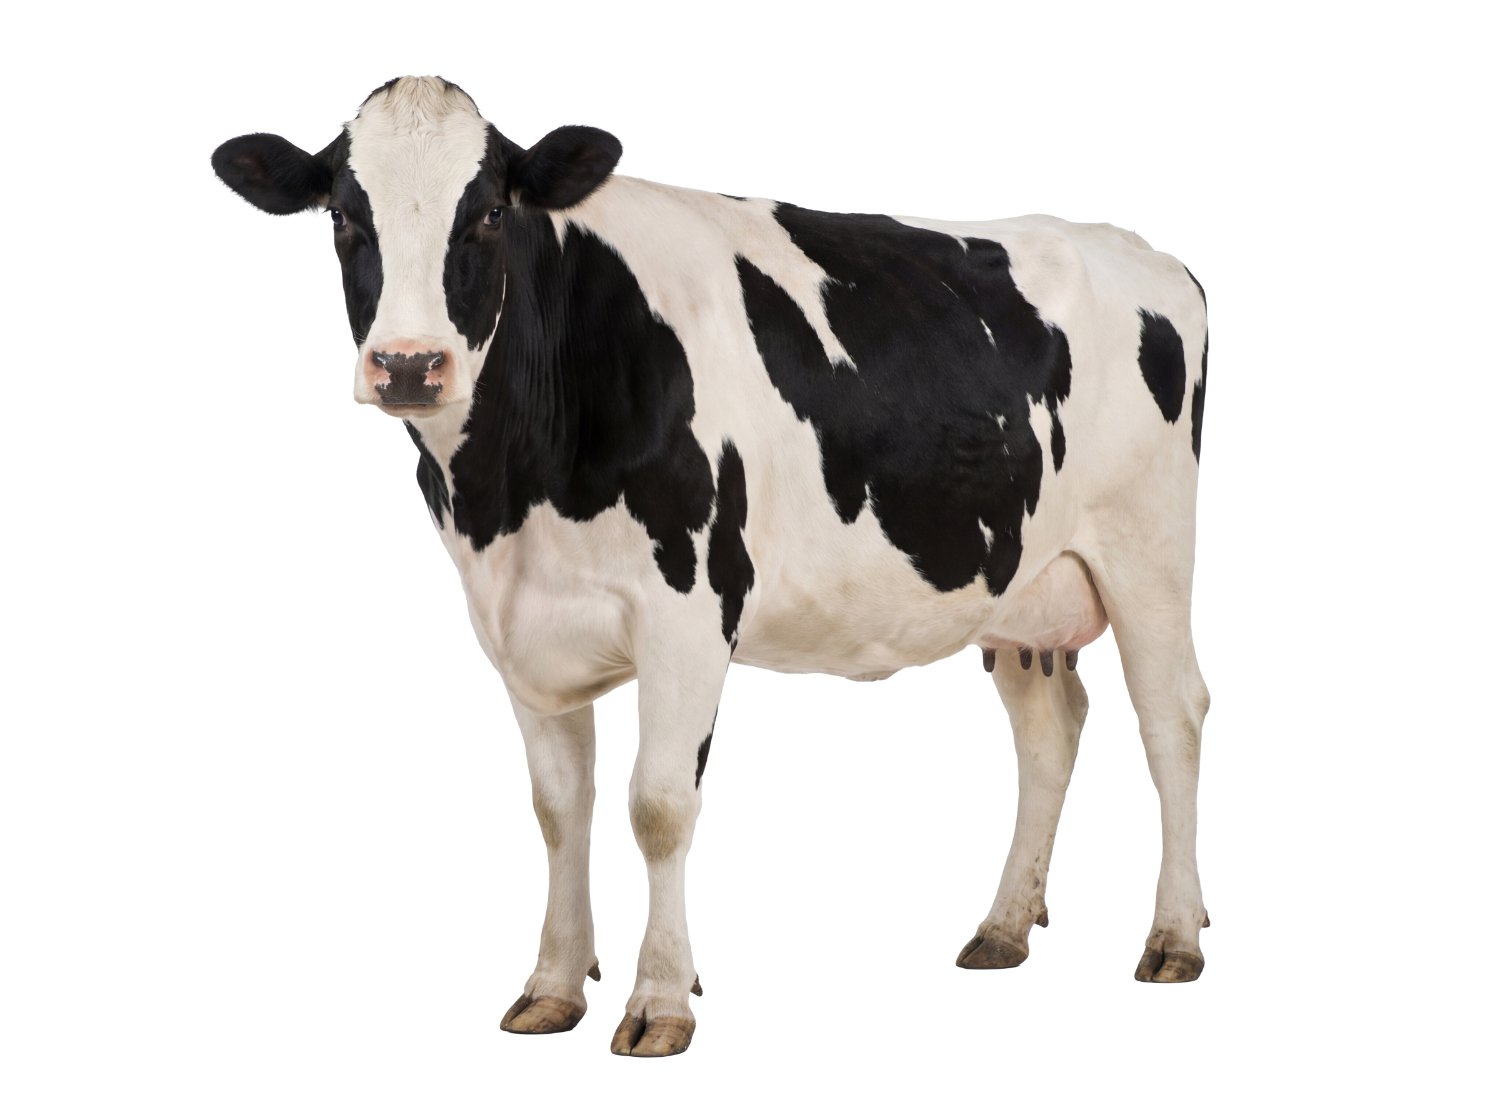
Nearly the same feed bunk. Very different milk out of it. A $1,356-per-year swing between these two cows — and you can't see it from the alley. The number on each cow is the only thing that can.
Three Tools. One Score.
Metabolic efficiency is measured, not modeled. GreenFeed reads what the feed becomes on the cow's breath; SmartFeed and SmartScale account for what she eats and what she weighs. No chute work, no scheduled weigh days, no added labor.
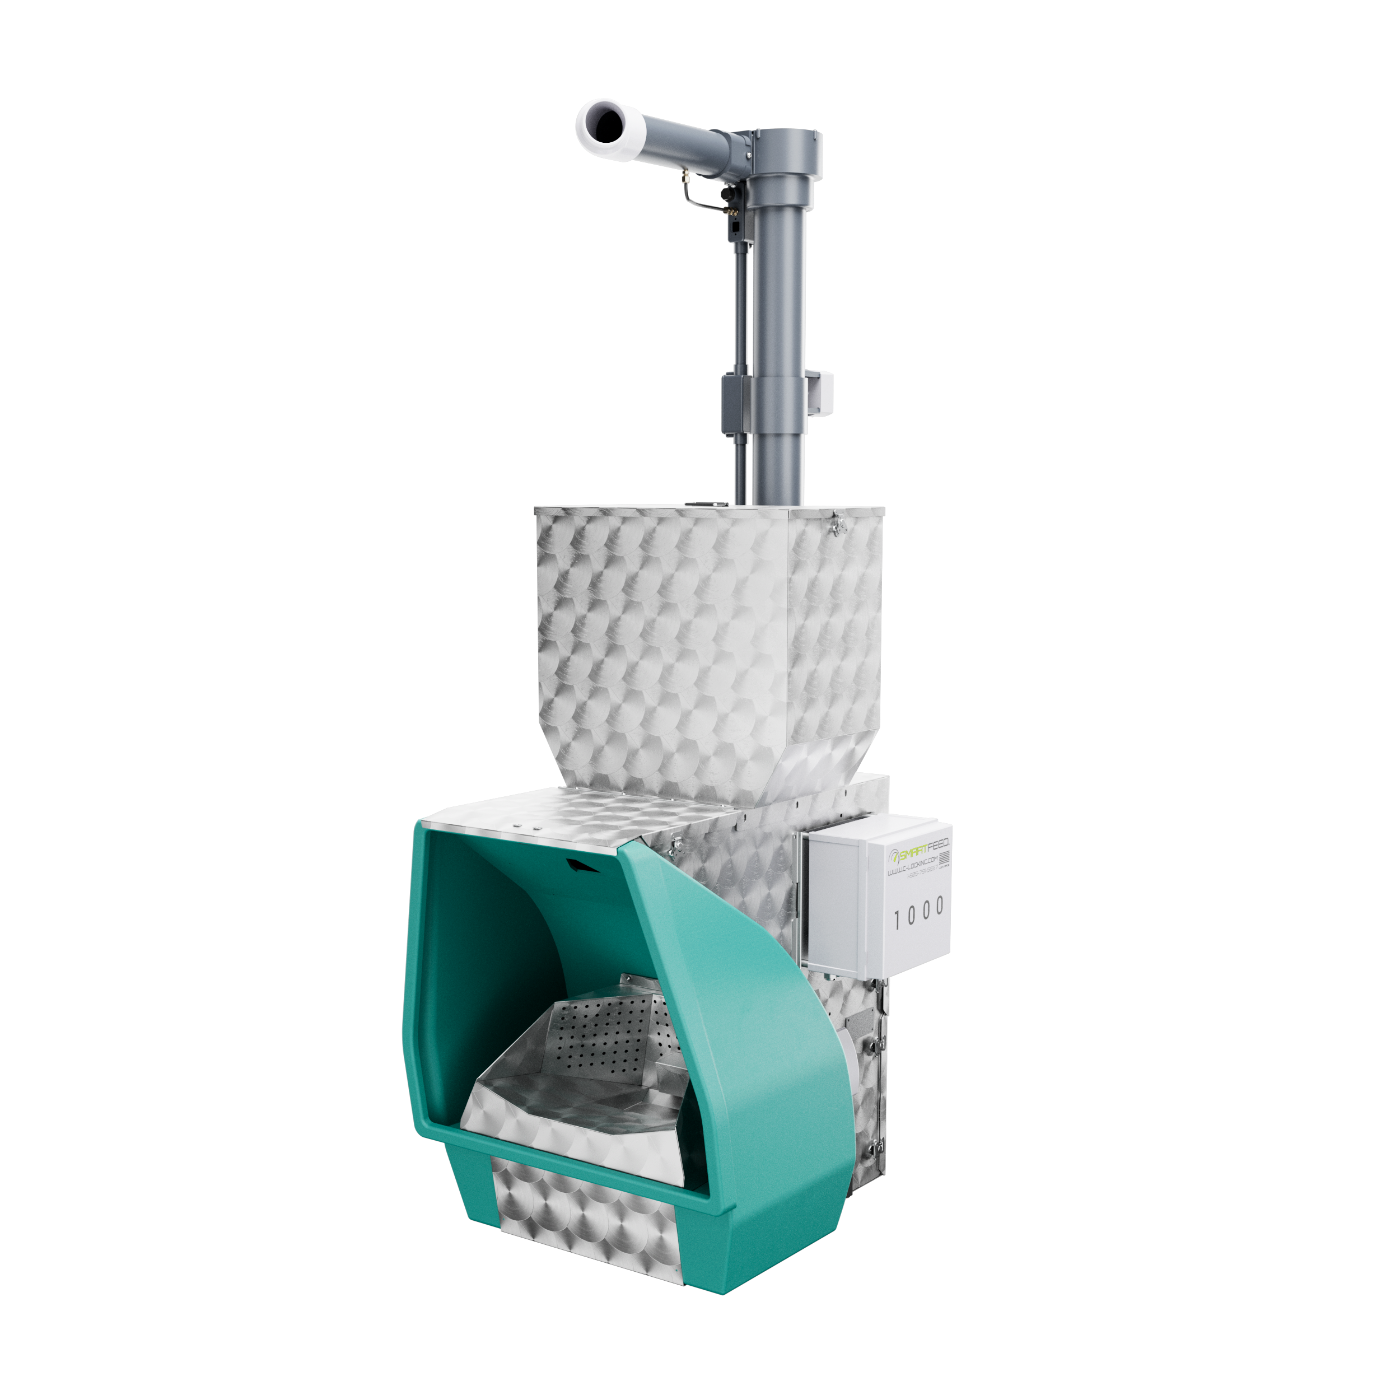
GreenFeed measures the cow's breath to show how efficiently she's turning feed into energy and milk. This is the metabolic efficiency piece — and nothing else on the market sees it.
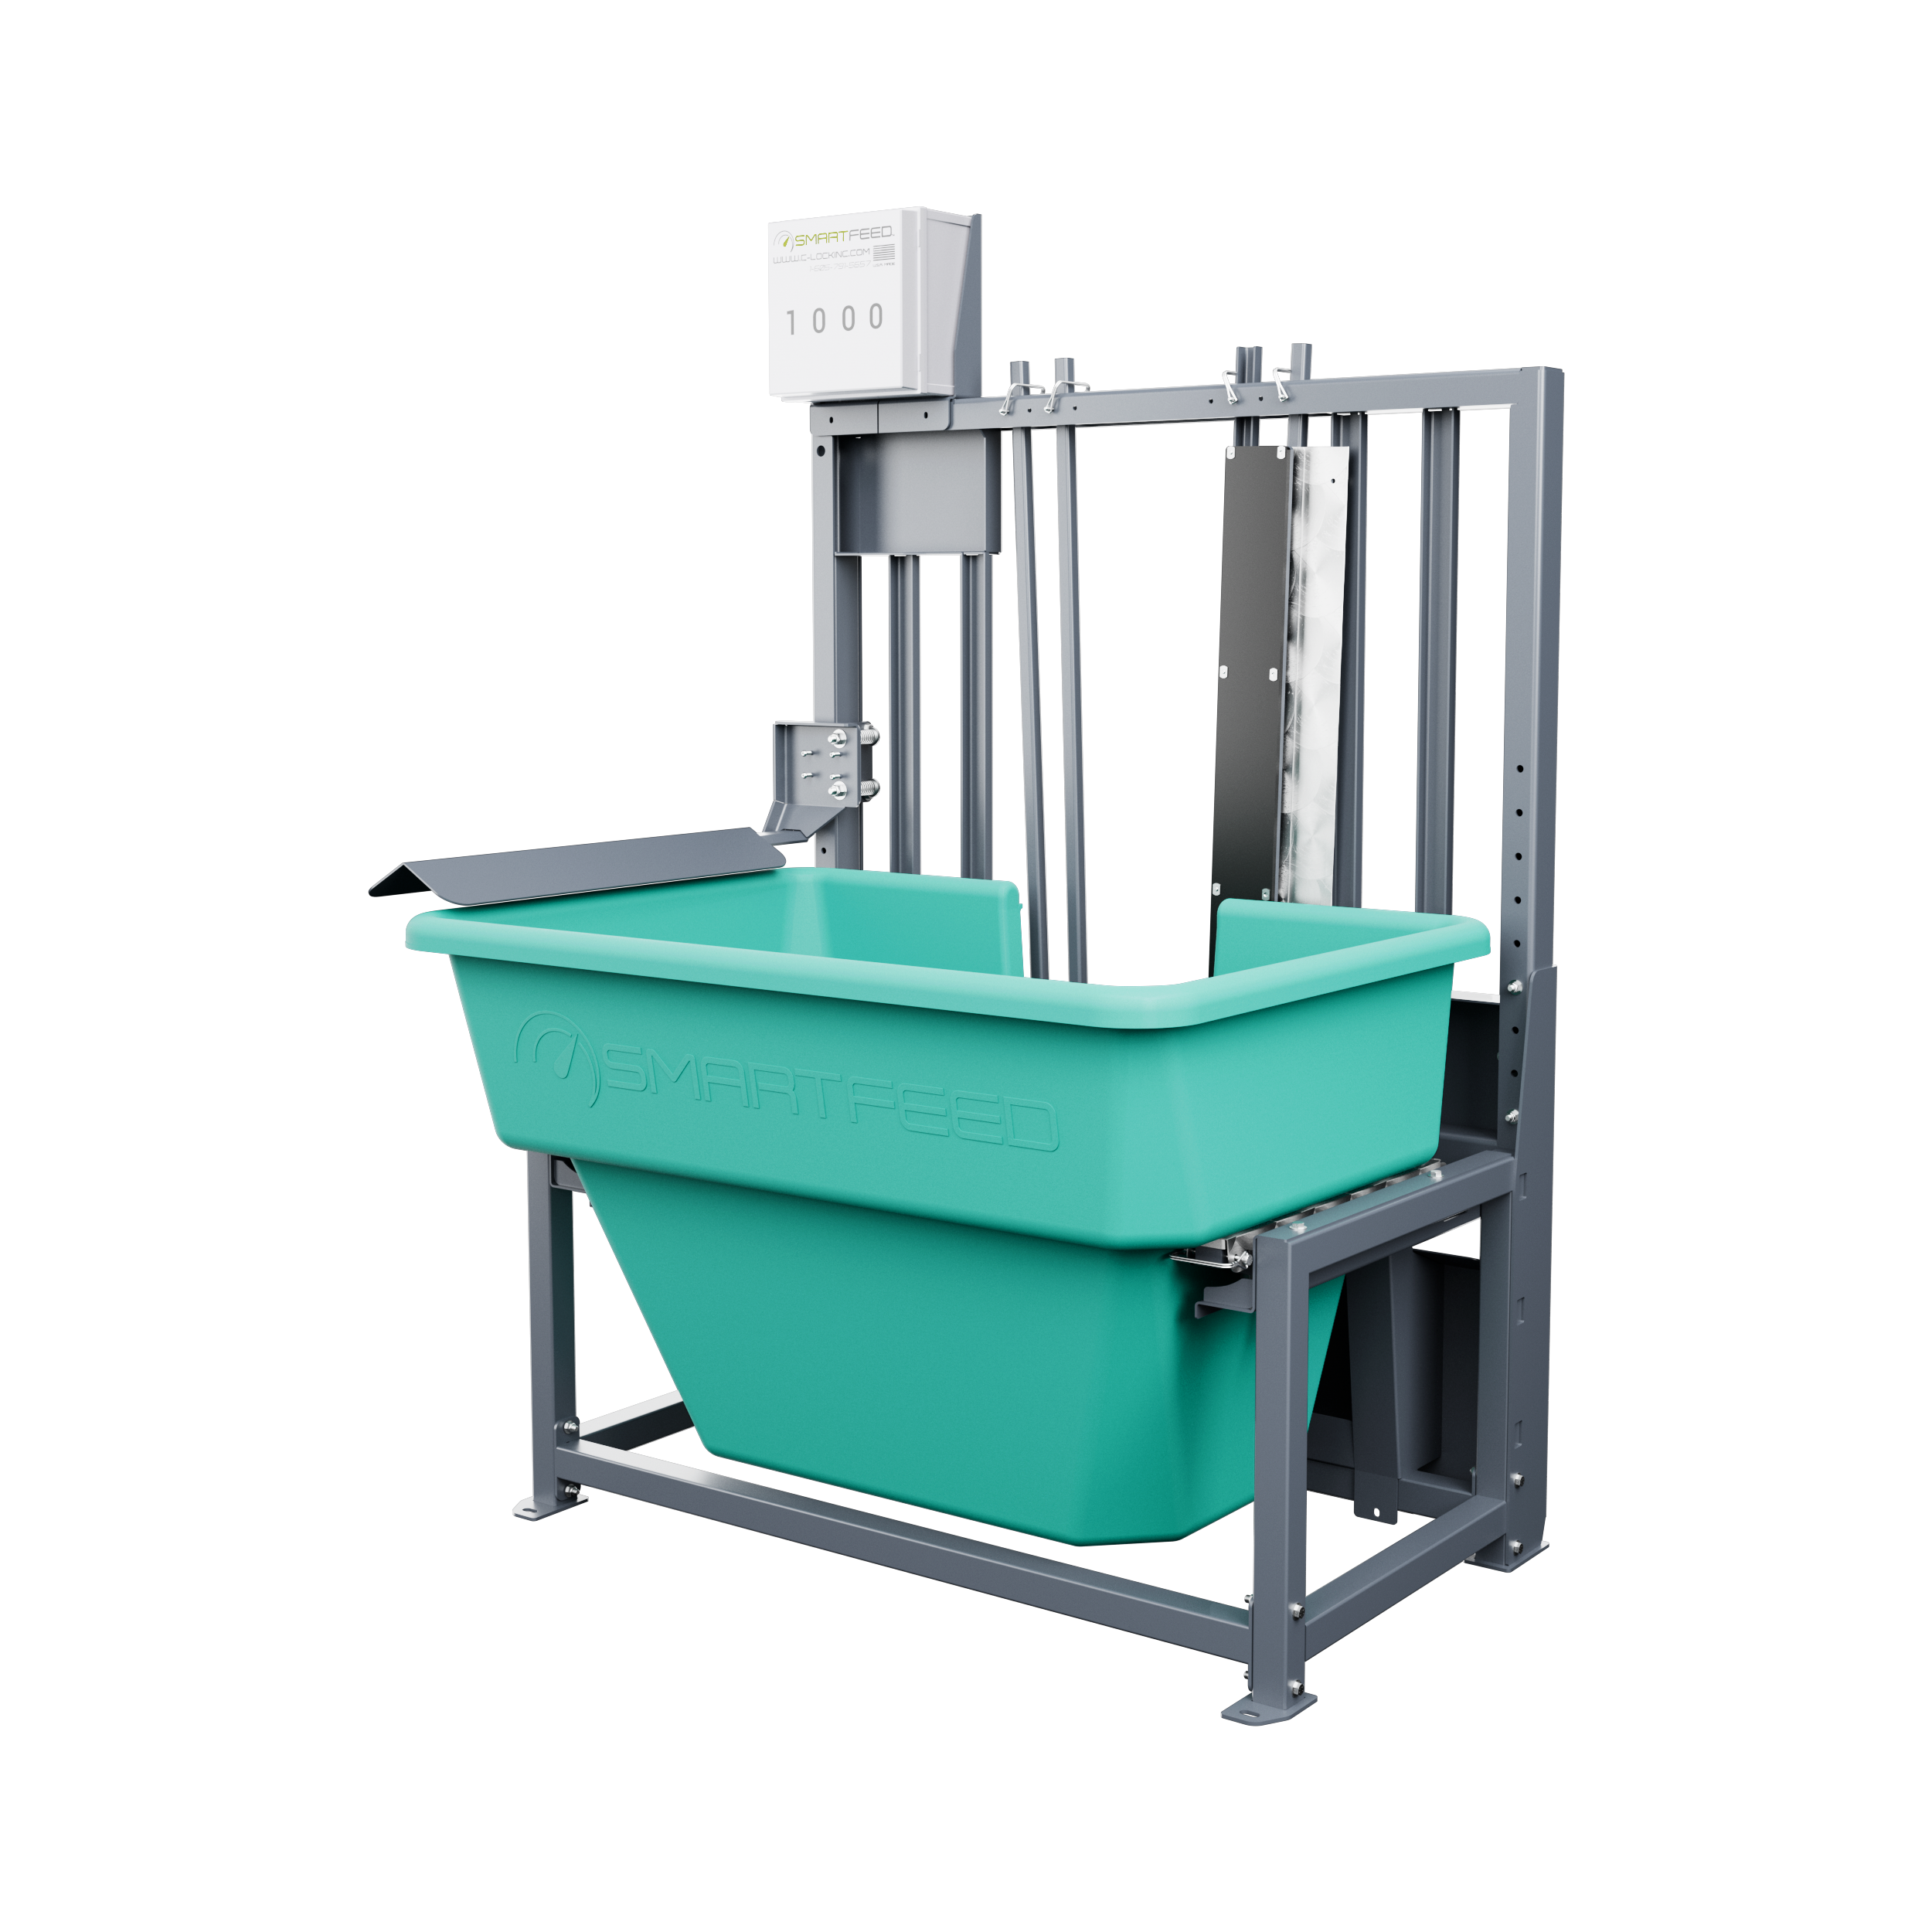
SmartFeed weighs every visit and ties it to the cow's RFID — individual intake, logged to the animal, not the herd. The cost side of the efficiency equation.
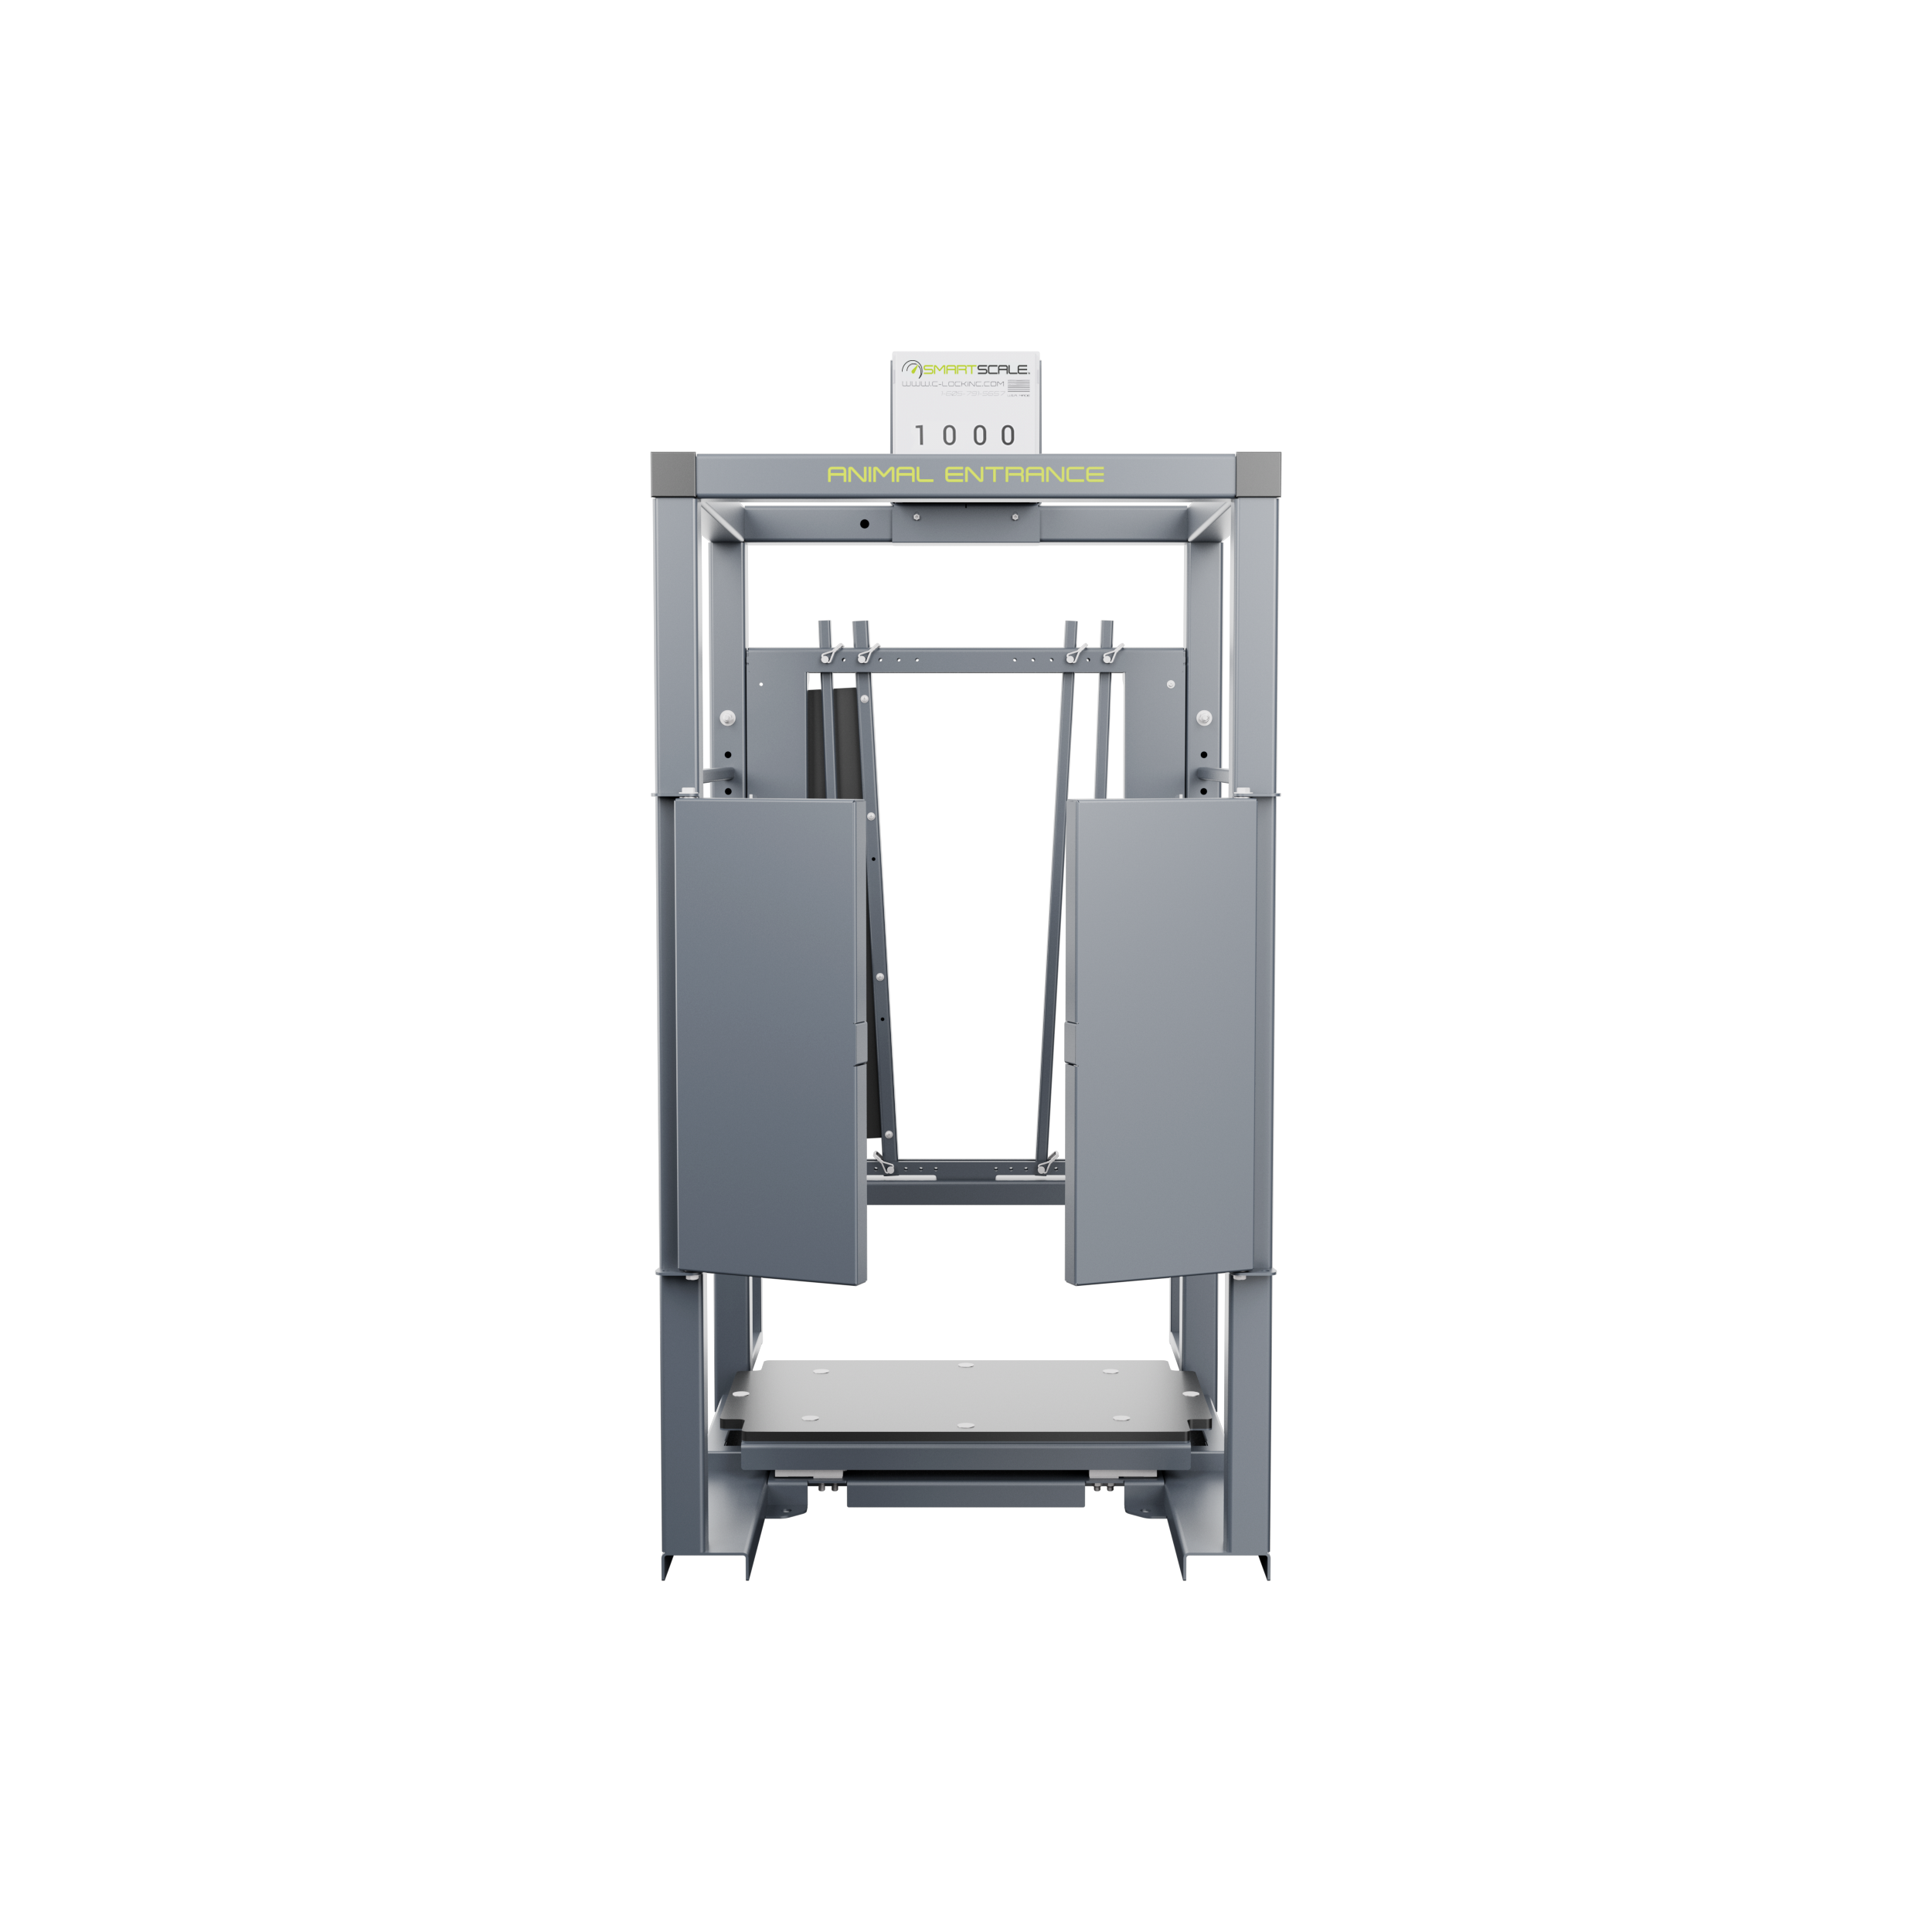
SmartScale logs body weight automatically as cows pass through — no chute, no scheduled weigh day. Body condition and gain, captured hands-off.
Pair what each cow eats with the milk she makes and how her body uses it, and you have the cleanest read on efficiency in the herd — ranked 0–100 against the cows she actually milks with.
The Value Is in the Cows You Keep.
You don't have to change rations or chase more milk to capture this. It's already in the parlor — the difference between the cows that convert efficiently and the ones that don't, sitting unranked in every string until somebody scores them.
Breed From the Cows That Convert.
A measured MEI score on every cow turns "she's a good one" into a number you can build a mating program around. Sexed semen and ET dollars go to the efficient end of the herd.
Keep the Heifers That Convert.
Raise replacements out of high-MEI dams, not by pedigree alone. Metabolic efficiency is heritable — efficient cows pass it to their daughters, lifting the herd average every generation.
Cut the Cows Costing You.
The bottom of the herd is honest about itself — those cows burn more feed for less milk, every lactation. MEI gives you a defensible cull line instead of a gut call.
By the Decile
Your Herd, Ranked Top to Bottom.
MEI scores every cow in the herd — not a hand-picked few — then sorts them into deciles. The most efficient decile sits at the top with the highest score, and each step down converts a little less feed into milk, all the way to the least efficient at the bottom. A clean staircase, the same shape every lactation.
Q1 · Top Quartile · D1 — D2.5
Q4 · Bottom Quartile · D7.5 — D10
Efficiency Is Heritable.
Metabolic efficiency isn't just a closeout statistic — it's a trait. The cows at the top of MEI carry it into the next generation. Breed a high-MEI dam to a high-MEI sire and the heifer inherits the engine, not the herd average. The gap compounds with every breeding decision you make on it.
Identify the most efficient cows in the herd.
MEI surfaces the best converters on real intake, real milk, and the breath itself — not pedigree estimates or proxy traits. The ranking sits on what the cow actually did.
Breed replacements from the top of the herd.
Raise heifers and target sexed semen at high-MEI dams. The cows that converted efficiently pass that efficiency to their daughters, lifting the herd average lactation over lactation.
Cull the cows costing you money.
The bottom of the herd is honest about itself — those cows burn more feed for less milk every lactation. MEI gives you a defensible, repeatable cull line.
Compound the gain across generations.
Each lactation you rank, breed, and cull on MEI, the herd average shifts. Over a few generations the bottom of your herd looks like the top did when you started.
Score Your Herd on What It Actually Did.
The fastest way to understand MEI is to see it run against a string of cows you already know. Bring us a recent group — we'll walk through the dataset, the ranking, and what the bottom quartile is costing you, cow by cow.