See What Feed Becomes.

Track how each animal converts feed into performance, efficiency, and profit.

C-Lock shows you exactly which animals are making you money and which are costing you, using clear, individual animal data. With that insight, you can make better decisions to improve efficiency and profitability across your operation.

SCROLL TO SEE WHAT THAT MEANS FOR YOUR OPERATION

C-Lock Improves Producer Profits

How C-Lock can put more money in producers' pockets

Feed accounts for up to 70% of a livestock producer's total operating cost — yet most operations have no way to know which individual animals are converting that feed into profit and which ones are burning it.

C-Lock changes that. By measuring feed efficiency at the individual animal level, we give you the data to breed better, feed smarter, and cull with confidence.

70%

Avg. percentage of operating cost allocated toward feed

Here’s a Scenario

Efficient animal

  • Daily production 67.0 lbs
  • Daily feed consumed 42.7 lbs
  • Feed conversion ratio 1.57 lbs milk / lb feed
  • Rumen efficiency 10.4 g CH₄ / kg milk
  • C-Lock score 77 / 100

Inefficient animal

  • Daily production 68.3 lbs
  • Daily feed consumed 57.7 lbs
  • Feed conversion ratio 1.18 lbs milk / lb feed
  • Rumen efficiency 17.7 g CH₄ / kg milk
  • C-Lock score 60 / 100

3.2×

Range in feed efficiency between most and least feed efficient animal in a pen.

$869 / Animal / Year

15 extra pounds of feed per day for essentially the same production. That's $869 per year, per animal — $2,348 over her lifetime. Multiply that across your bottom quartile and the number gets uncomfortable fast. On a 1,000-animal operation, the gap between your top and bottom 25% is $468,000 every single year.

What C-Lock Delivers

Four Solutions Every Producer Needs. Our Tool Solves Them All.

1

Performance Management

We tell you which animals are losing you money. Today.

Not last month. Not at the end of the season. Today — with a specific dollar amount attached to each animal. No other tool delivers this at the individual animal level in real time.

2

Profitability Insights

We give you data to make the right decisions.

Dry her off. Call the vet. Watch her. Cull her. The action is built into the measurement — based on their specific data, not a calendar or a herd average. No interpretation required.

3

Metabolic Efficiency

We show you what your feed actually became.

Milk. Muscle. Fat. Heat. Every competitor tells you what you fed. Only C-Lock tells you what each animal did with it — physically impossible to measure any other way.

4

Sustainability

We give you data everyone in the room will believe.

Your banker. Your packer. Your nutritionist. Measured, auditable, peer-reviewed — not a model, not an estimate. The same measurement that tracks daily profit also produces defensible emissions data.

Your Operation. Your Numbers.

Partnering with Dairy and Ruminant Livestock Producers

The four solutions above apply to every producer. Below is specific to your operation.

Dairy

Know which cows are paying you back — every single morning.

Every cow in your herd has a feed bill and a milk check. Some cover theirs. Some don't. Your herd average can't tell you which is which. Flux can.

Metabolic Efficiency Index Ranks each animal in your herd by how efficiently it converts feed into milk, helping you quickly identify your most and least profitable producers.

Dry-off timing driven by data, not a calendar A calendar treats every cow the same. C-Lock flags the specific day she crosses below break-even level, on average 40 days before the calendar would act.

Health flag before clinical signs appear Milk drops before intake during health events. A mid-lactation cow below 65% of expected ECM gets a Health Check flag — not a dry-off order.

Robot integration — automated at scale 55,000–75,000 visits per robot per year. Every visit scored. Every cow tracked. Daily report in your inbox every morning.

Dairy Solutions

Ruminant Livestock Producer

Same pen. Same feed. Completely different cost of gain.

Two steers side by side. One is building muscle. The other is burning your feed as heat and fat you didn't intend to put there yet. Your pen average can't see it. Flux can.

CGI ranking — cost of gain per animal Every animal in your contemporary group ranked by actual cost of gain. Not pen averages. Individual animals. The spread between top and bottom quartile is your opportunity.

Caloric Efficiency Calculator Identifies which animals efficiently convert feed calories into meat gain and which waste energy as heat, helping you pinpoint costly inefficiencies within your herd.

Days to Finish 100+ days separates your most and least efficient animals in the same contemporary group. Stop guessing which one is ready. Measure it.

Efficiency drives profitability Identifying your most efficient animals provides value down the chain. Feed savings. Breeding decisions. Marketing value. Ration evaluation. Measuring efficiency drives it all.

Ruminant Livestock Solutions

How It Works

01

On-Farm Installation

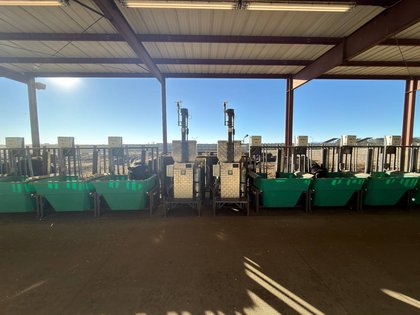
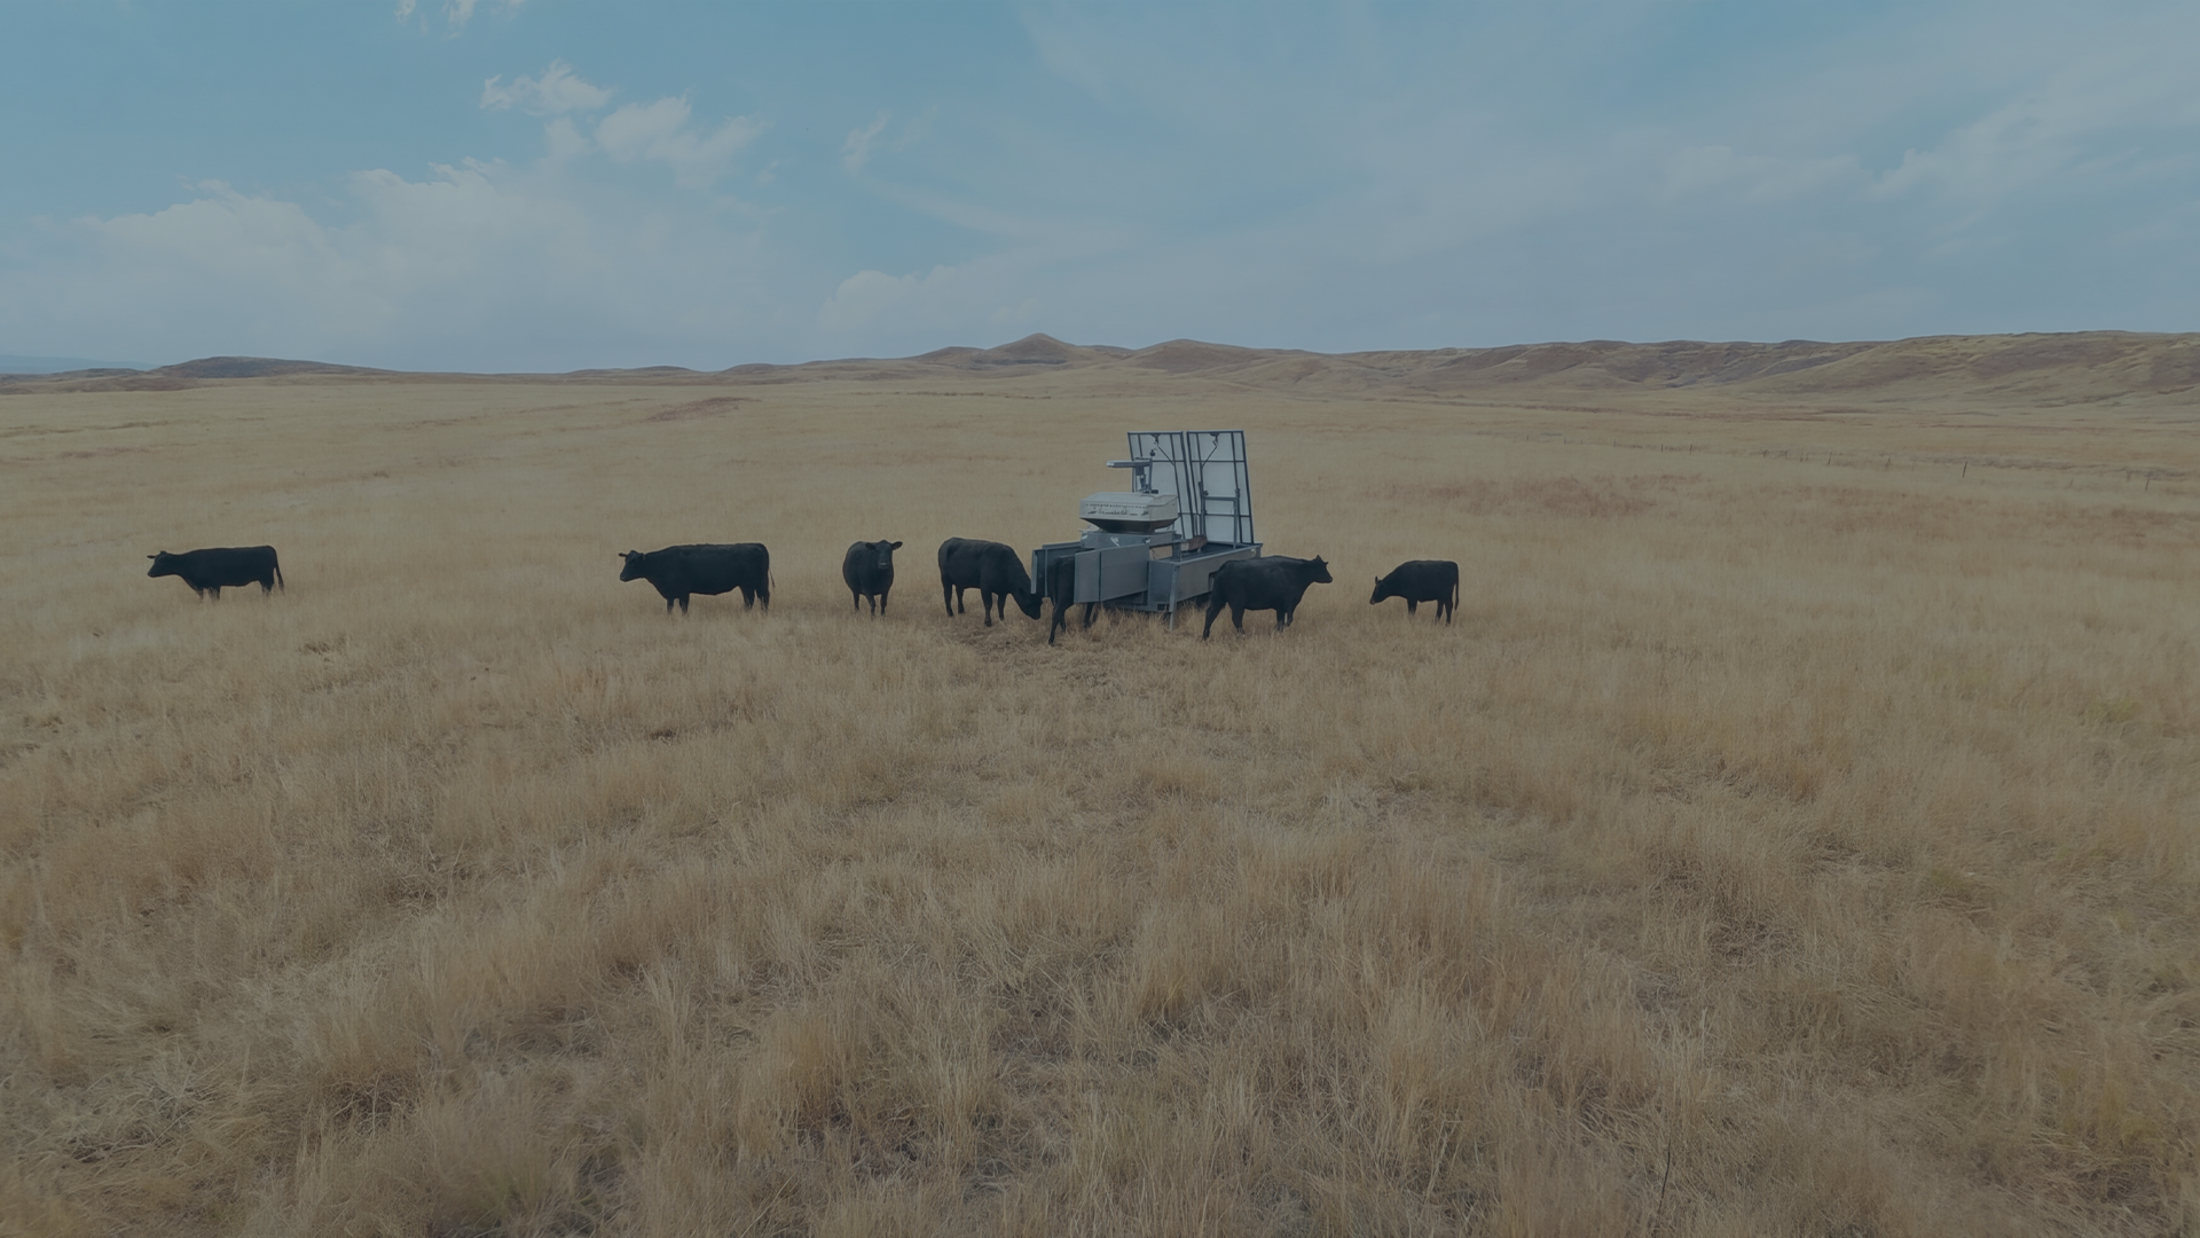
Your C-Lock system is set up in your pen or animal management area, integrating easily into your existing operation.

02

Measure Animal Performance

As animals use the system, it automatically collects individual data on intake, efficiency and performance with minimal added labor.

03

Track Animal Performance

Get clear, straightforward information, like average daily gain, feed efficiency, and herd rankings, so you can quickly spot trends, top performers, and those falling behind.

04

Manage with Confidence

Use that information to guide breeding, feeding, and replacement decisions, helping you improve efficiency, increase profits, and make decisions backed by data.

Products


GreenFeed

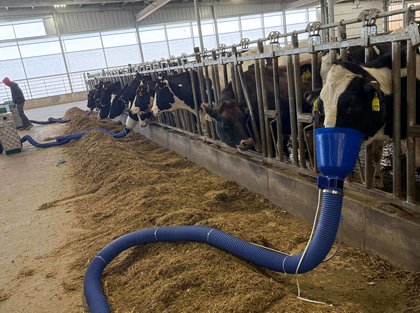
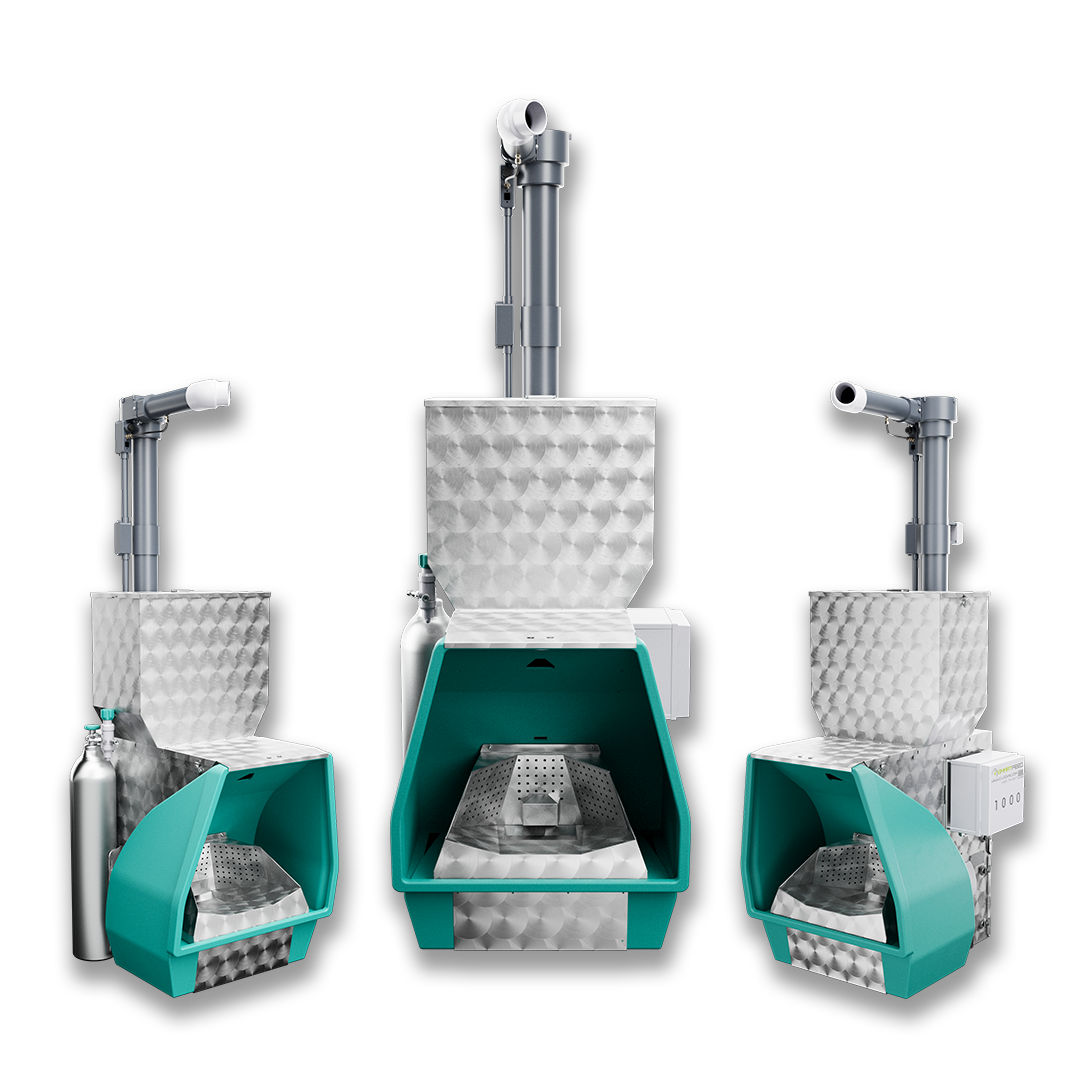
C-Lock’s emissions monitoring solutions are designed to accurately measure and analyze enteric methane and other emissions from livestock. Our GreenFeed system measures the following emissions from ruminant animals:

  • Methane (CH4)
  • Carbon Dioxide (CO2)
  • Hydrogen (H2)
  • Oxygen (O2)
 

SmartLine

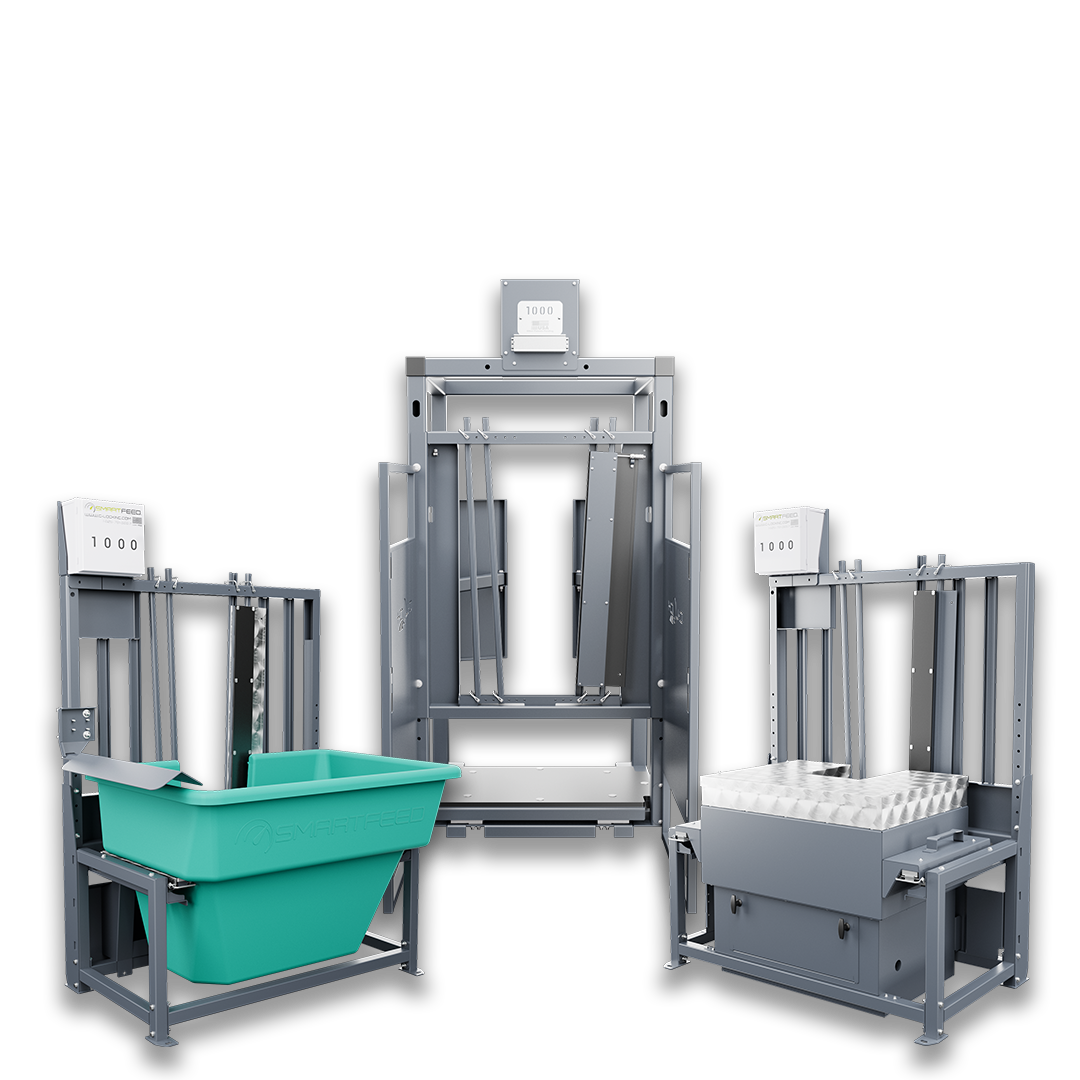
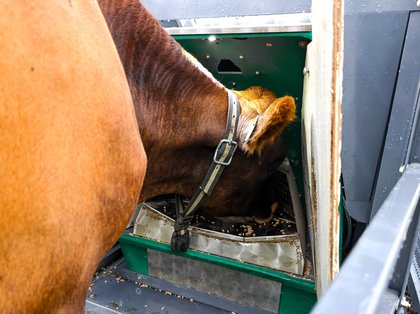
Our performance monitoring solutions are designed to deliver precise, individual animal data to better understand intake behavior, growth, and overall efficiency. Our SmartLine systems work together to continuously measure feed intake, water consumption, and body weight at the individual animal level.

  • SmartFeed - Measures Feed Intake
  • SmartScale - Measures Body Weight
  • SmartWater - Measures Water Intake
  • Pro Models - Control Water & Feed Consumption