

CGI
Cost of Gain Index
Identify the Genetics That Increase Profitability.
Feed efficiency may be the most important trait you raise and the one buyers have never been able to see. C-Lock's CGI puts a measurable value on it, turning your genetics from a promise into proof.
A dollar figure for what it costs each animal in your herd to gain a pound of weight.
C-Lock ranks your animals, identifies your best and worst gainers, and gives you the hard numbers to make better breeding and management decisions.
More feed per pound of gain. Eating into your margin.
Less feed per pound of gain. Your most efficient animals.
Two Bulls. Same Pen. Different Engines.
Two bulls can eat the same ration, stand in the same test pen, and look the same over the rail, yet convert feed into gain at very different rates. That difference is heritable, and it rides straight into their calves. Without per-animal measurement you can't see it, and neither can the buyer studying your sale catalog.
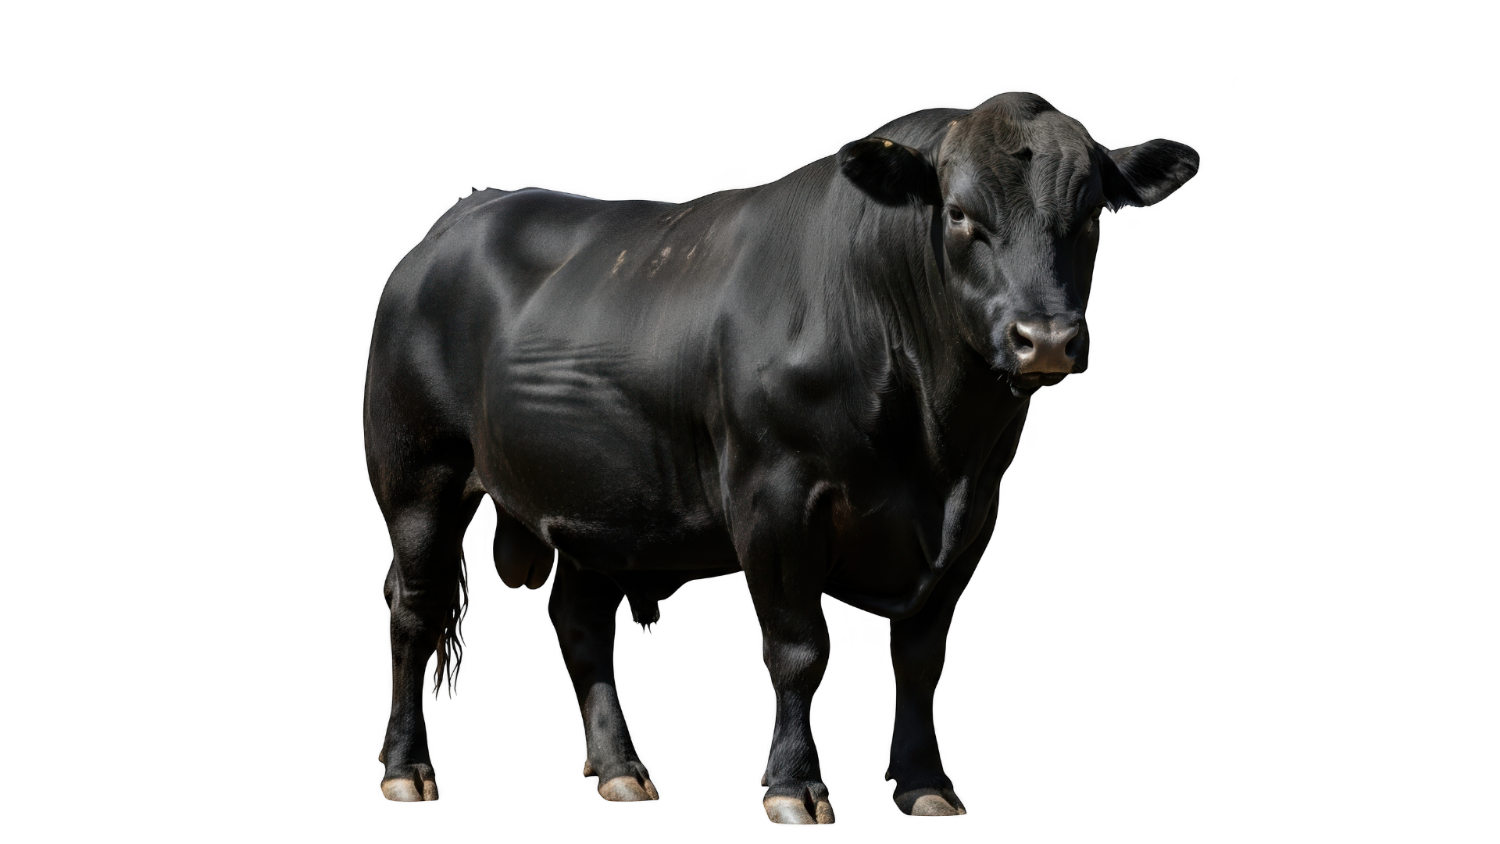
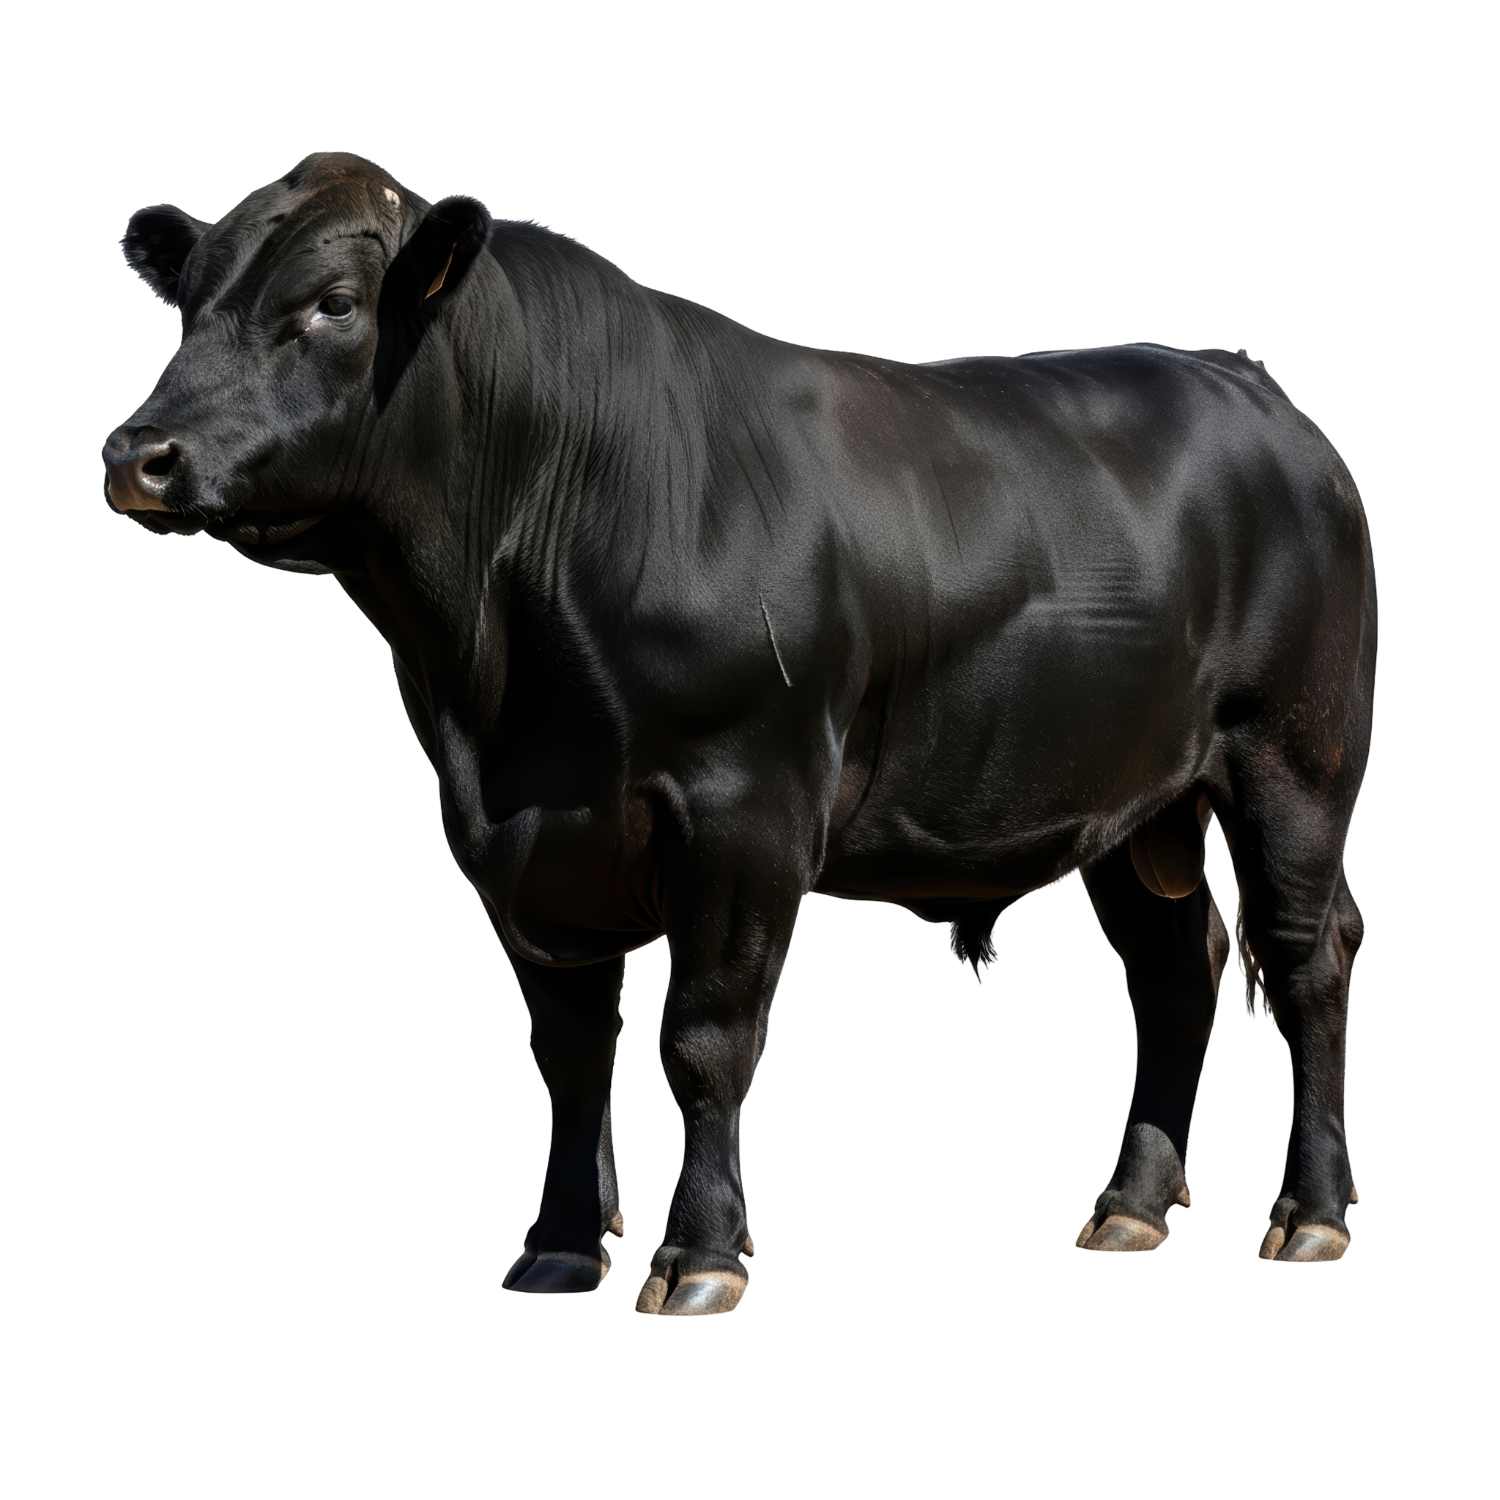
Same intake range. Nearly identical daily gain on the scale. Almost twice the cost per pound. Side by side, you couldn’t pick the winner. The number on every animal is the only thing that can.
How It Works.
Two pieces of C-Lock hardware sit in the pen: SmartFeed records individual feed intake at the bunk, SmartScale records body weight at the water source. No chute work, no scheduled weigh days, no added labor.
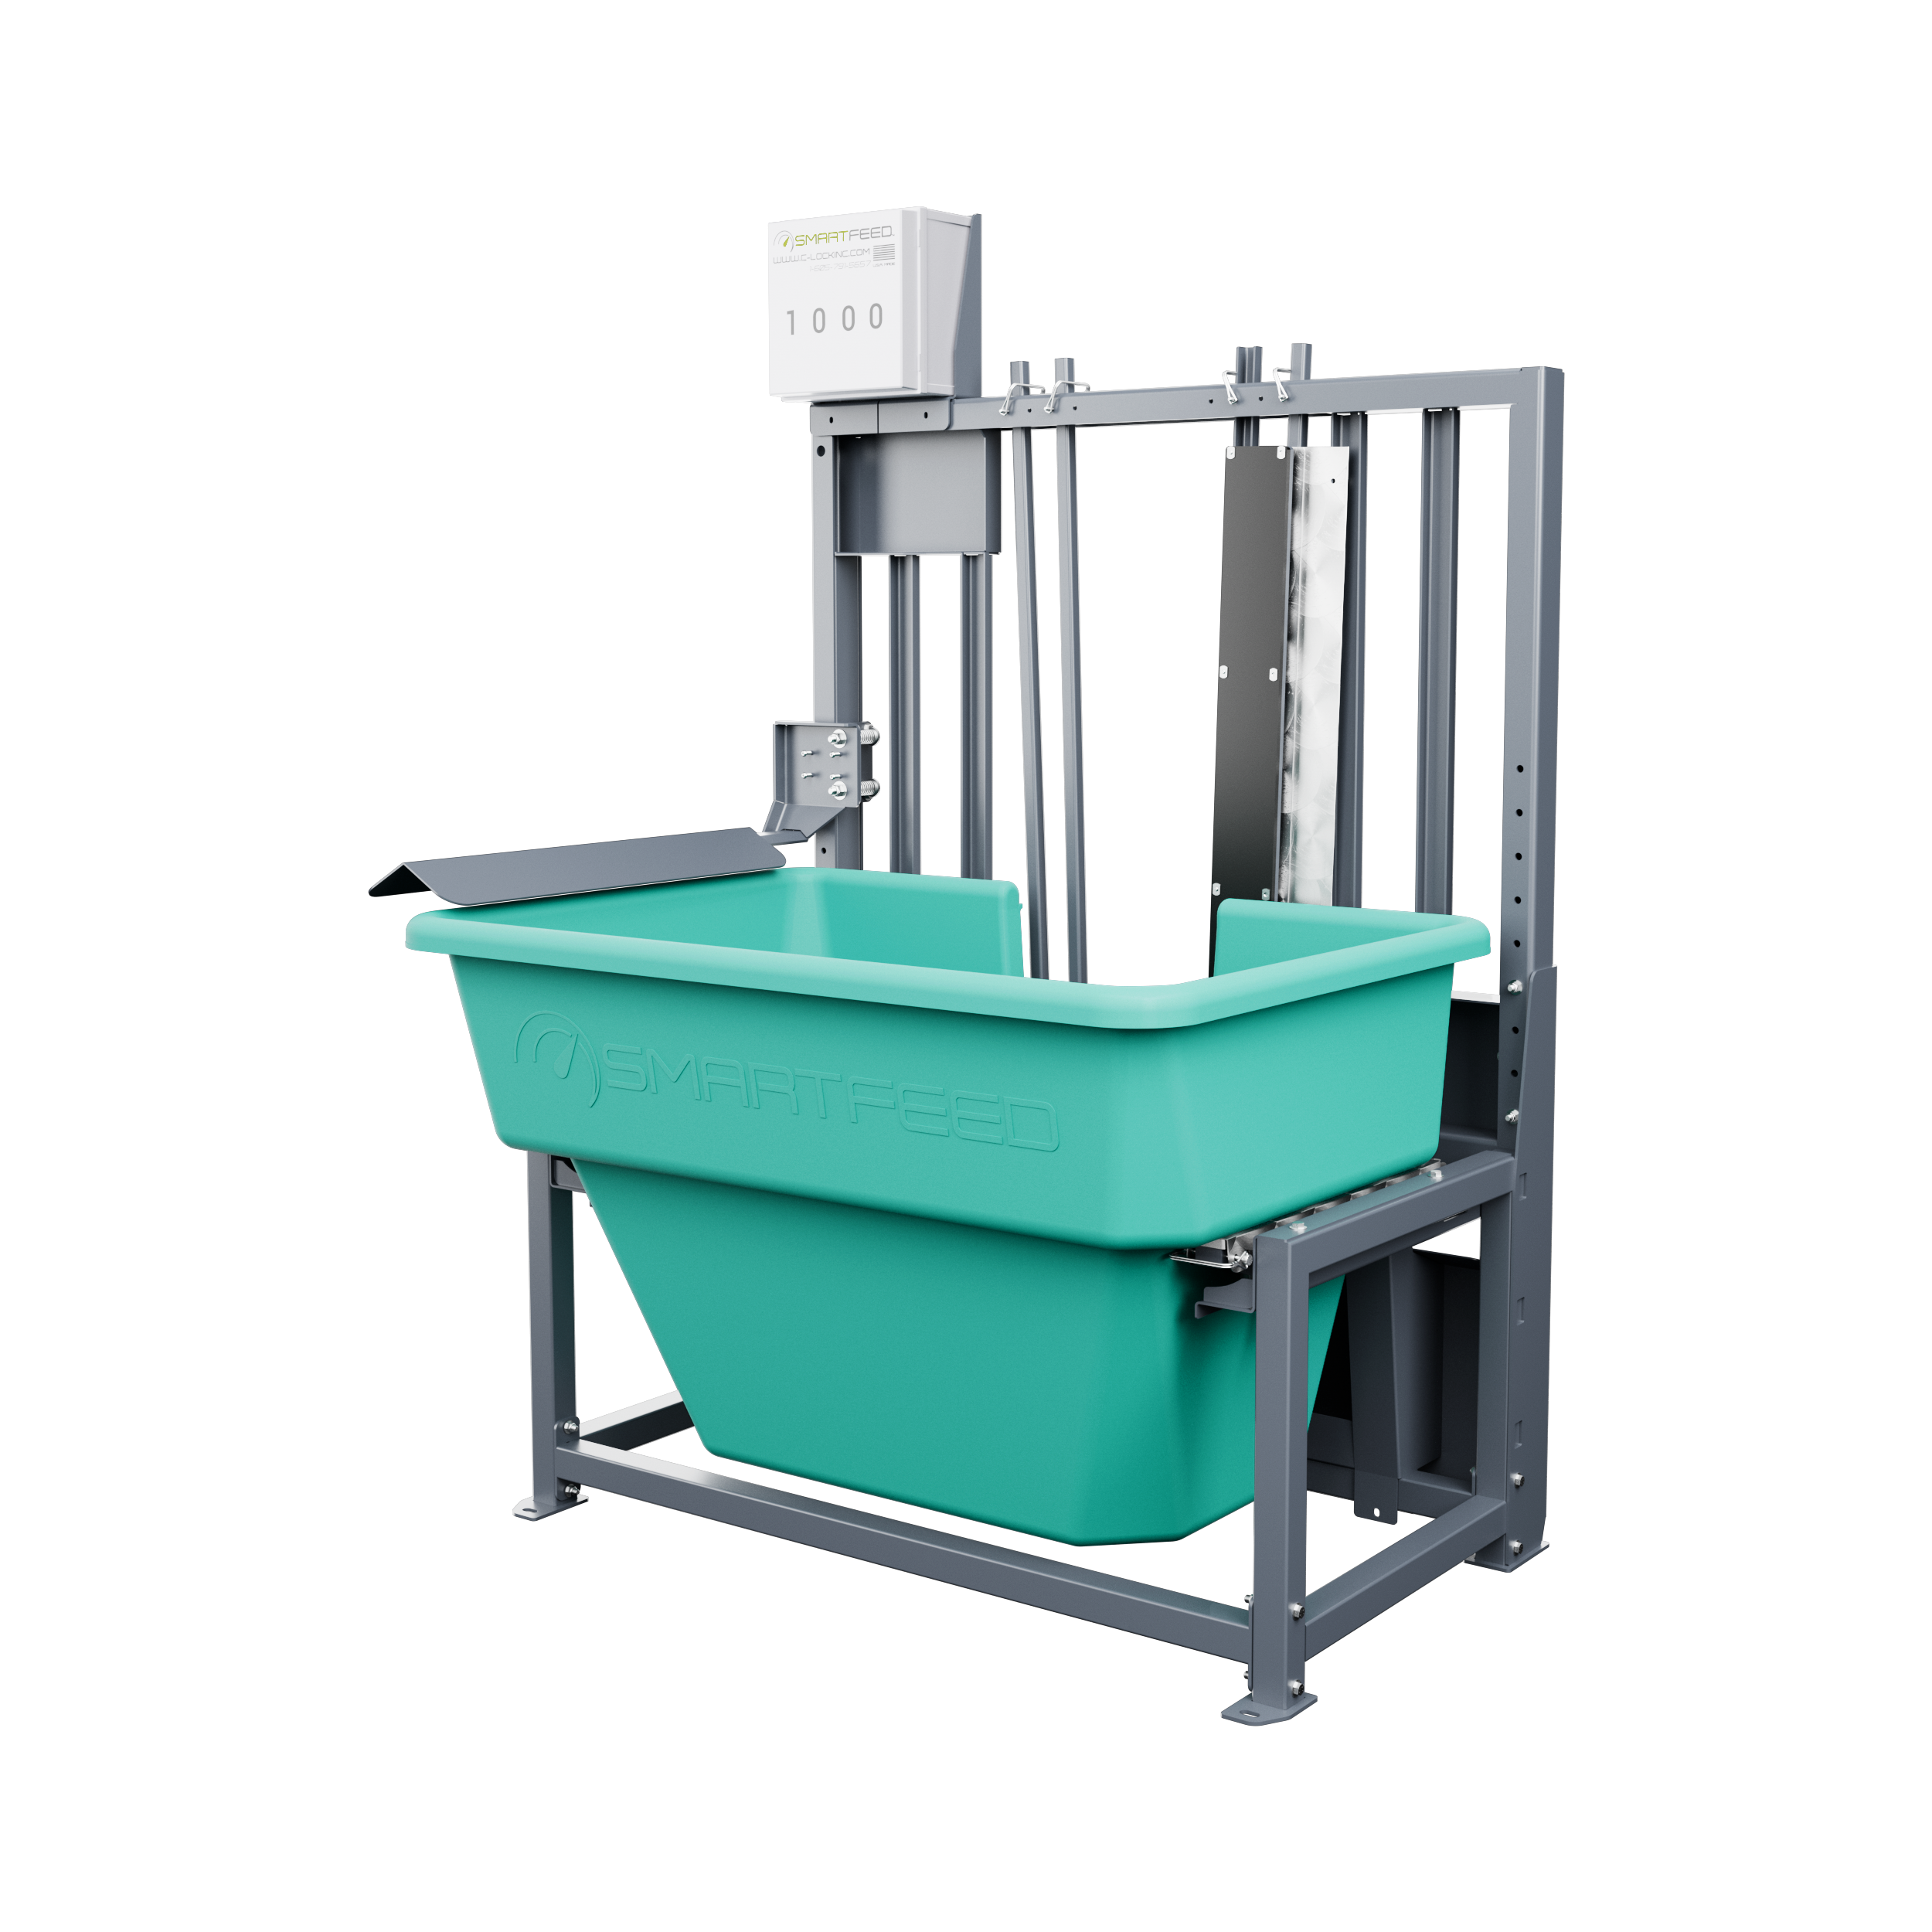
Animals walk up and eat on their own schedule. The RFID reader identifies the animal, the bunk weighs the visit, and intake is logged to the animal — not the pen. Every meal, every day, automatically.
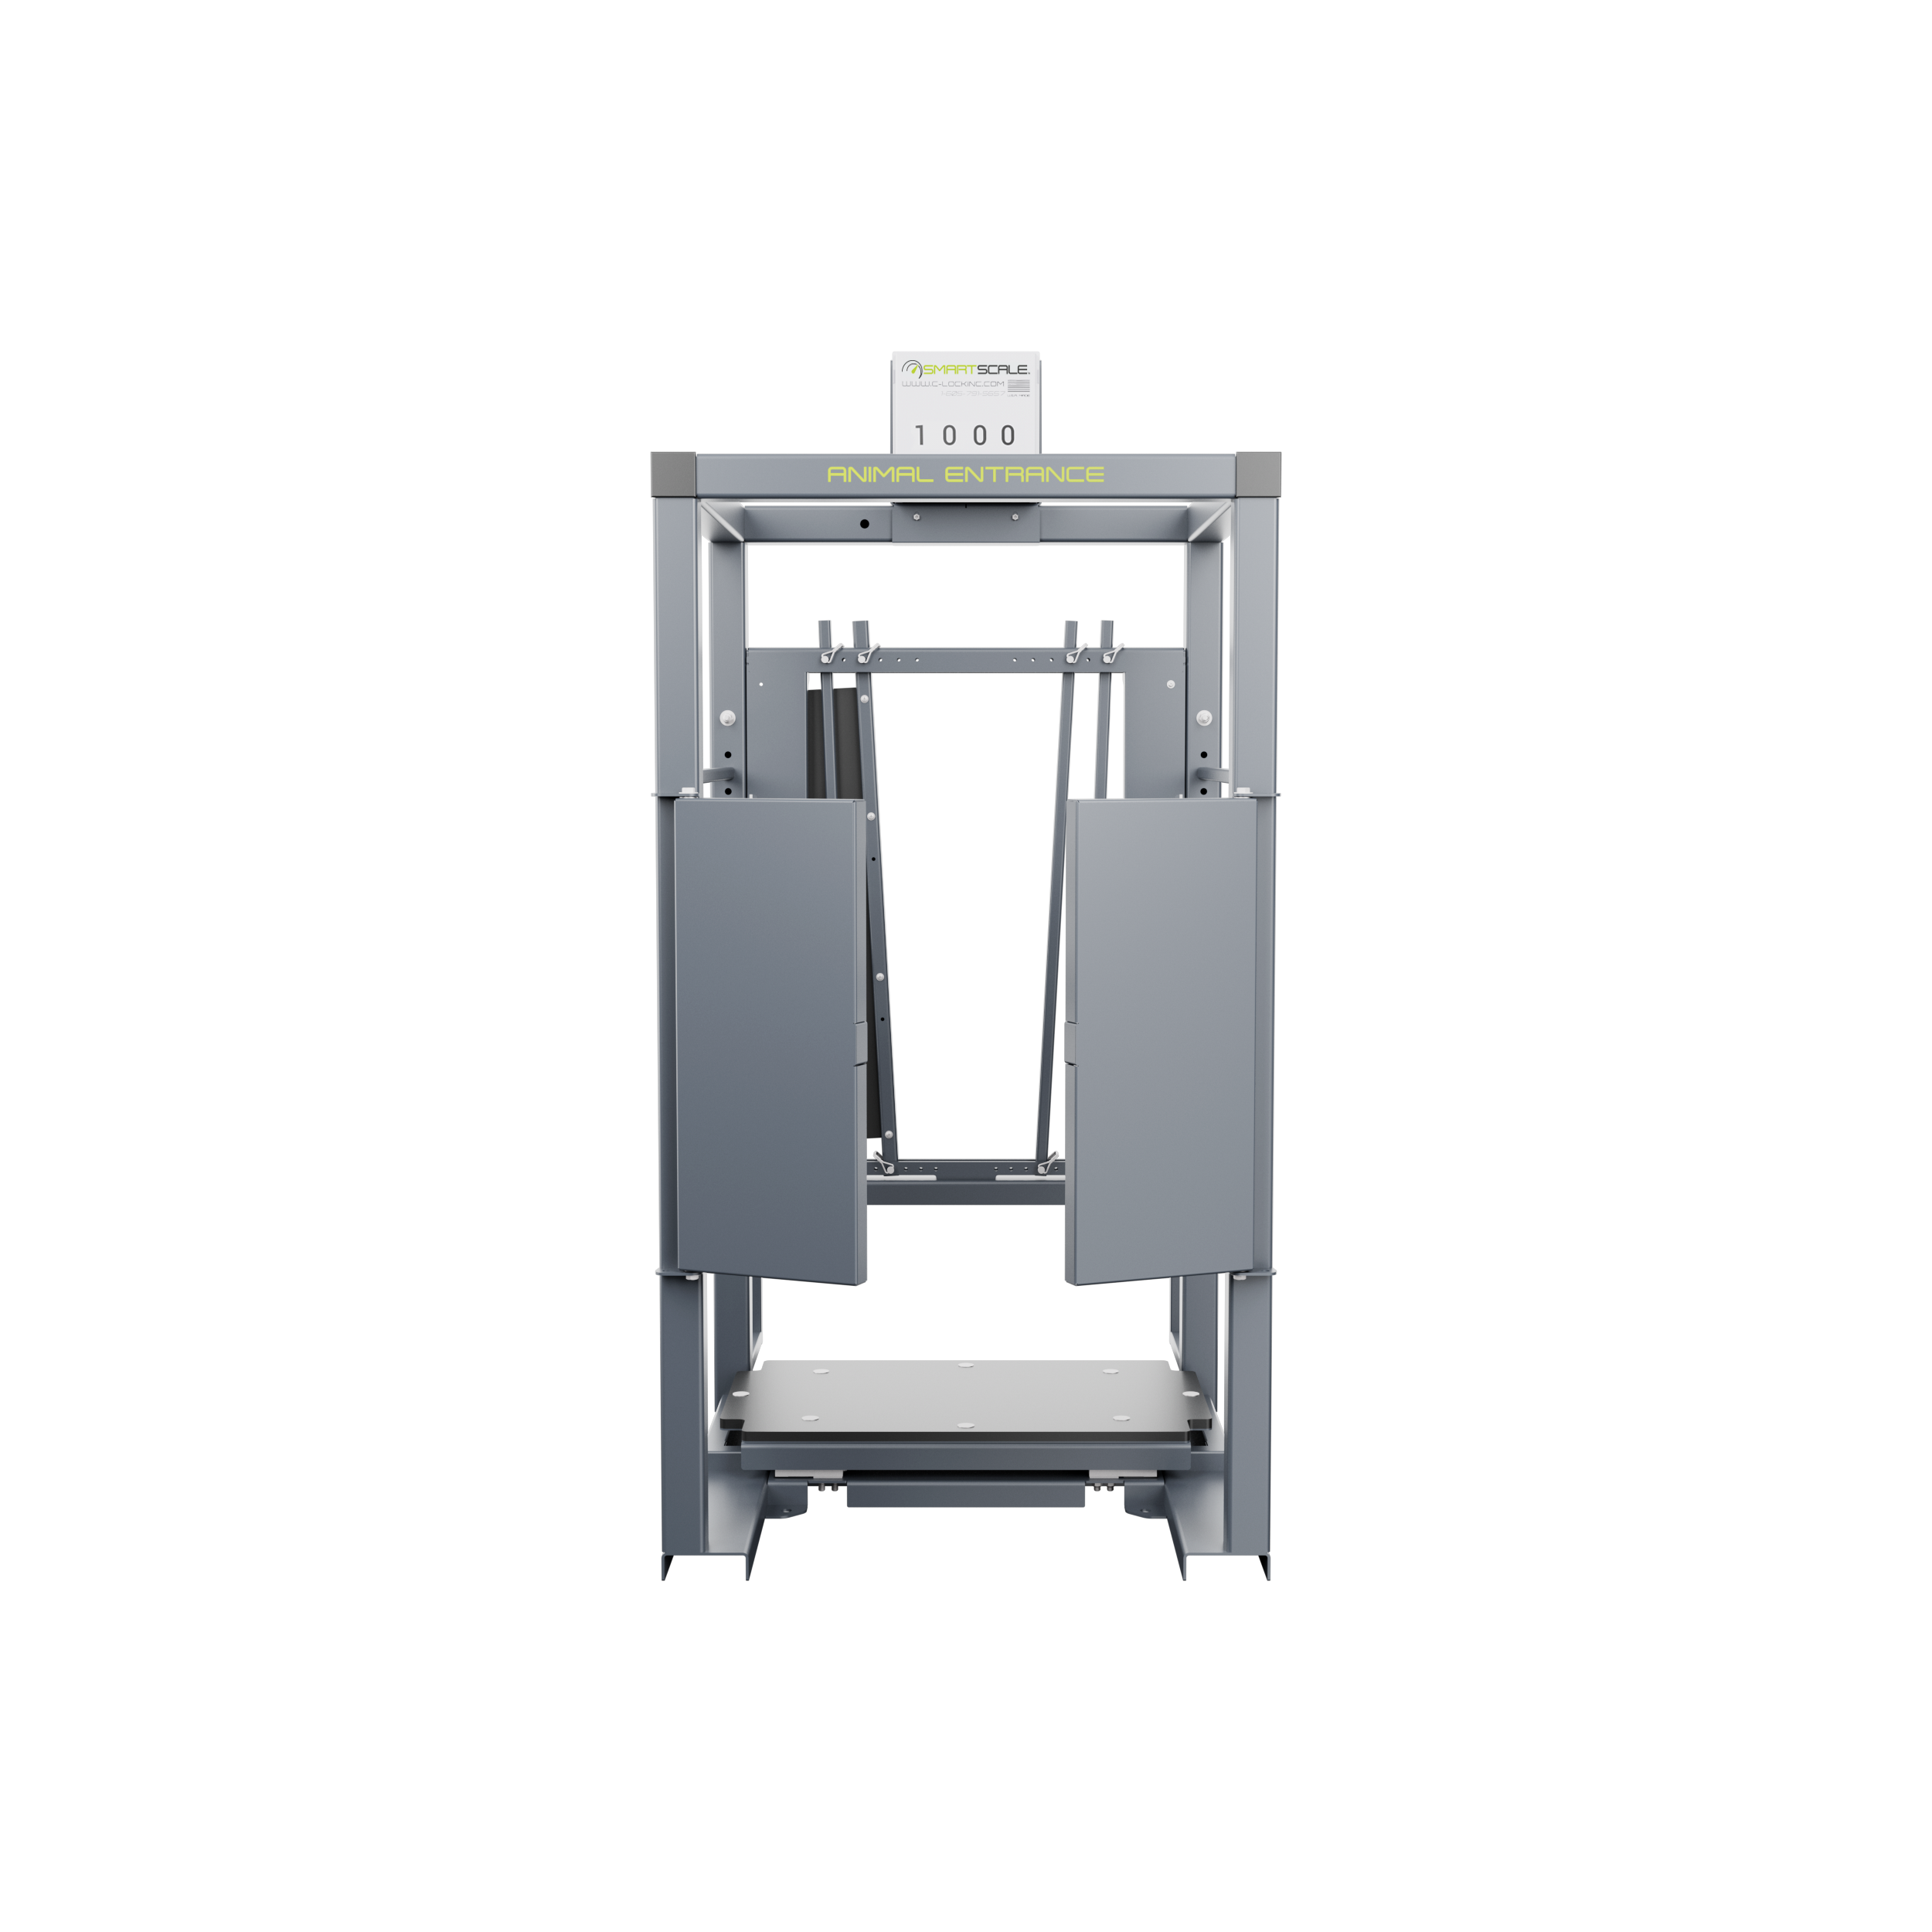
Mounted in front of the water tank, SmartScale weighs every animal every time they drink. Daily body weight, captured without ever moving the animal — no chute, no shrink, no scheduled weigh day.
Multiply each animal's daily intake by your real ration cost. Divide by the pounds they actually gained. The result is the cleanest number in your pen — ranked 0–100 against the contemporary group it ran with.
The Value Is in the Genetics You Keep.
You don't have to change rations or buy a new sire to capture this. It's already in your pen — the difference between the genetics that convert cheaply and the ones that don't, sitting unranked in every contemporary group until somebody scores them.
Market Your Top End With Data.
A measured CGI score on every bull and replacement turns "good doing kind" into a number your buyers can stand behind. Back your sale catalog with proof, not appraisal.
Keep the Females That Convert.
Pull replacement heifers from the top of CGI, not from looks. Feed efficiency is heritable — the animals that converted cheaply pass that on to the next calf crop.
Cut the Genetics Costing You.
The bottom decile is honest about itself — it costs more to feed and passes that on every cycle. CGI gives you a defensible cutoff line for culling or terminal-marketing.
By the Decile
Your Herd, Ranked Top to Bottom.
CGI scores every animal in the contemporary group — not a cherry-picked subset — then sorts them into deciles. The most efficient decile sits at the top with the lowest cost of gain, and each step down costs more per pound, all the way to the least efficient at the bottom. A clean staircase, the same shape every cycle.
Q1 · Top Quartile · D1 — D2.5
Q4 · Bottom Quartile · D7.5 — D10
Efficiency Is Heritable.
Feed efficiency isn't just a closeout statistic — it's a trait. The animals at the top of CGI carry it into the next generation. Pair a high-CGI sire with a high-CGI dam, and the calf inherits the engine, not the average. The gap compounds with every breeding cycle you make selection decisions on.
Identify the top performers in the actual herd.
CGI surfaces the best converters in every contemporary group on real intake and real gain. No estimation, no proxy traits. The ranking sits on what the body did, not what the EPD predicted.
Retain heifers and bulls from the top quartile.
Heifers and bulls from the top quartile carry the feed efficiency that produced their score. Used as replacements or sires, they lift the cohort average cycle over cycle.
Cull or terminal-market the bottom decile.
The bottom decile is honest about itself — those animals cost more to feed every cycle and pass that on. CGI gives you a defensible, repeatable cutoff line.
Compound the gain across generations.
Each cycle you rank, retain, and cull on CGI, the cohort average shifts. Over three to five generations the bottom of your herd looks like the top did when you started.
Score Your Next Cohort on What It Actually Did.
The fastest way to understand CGI is to see it run against a contemporary group you already know. Bring us a recent cycle — we'll walk through the dataset, the ranking, and what the bottom decile cost you, line by line.