
Take a look under the hood of your herd with C-Lock and find the cows driving profit and the ones holding you back.
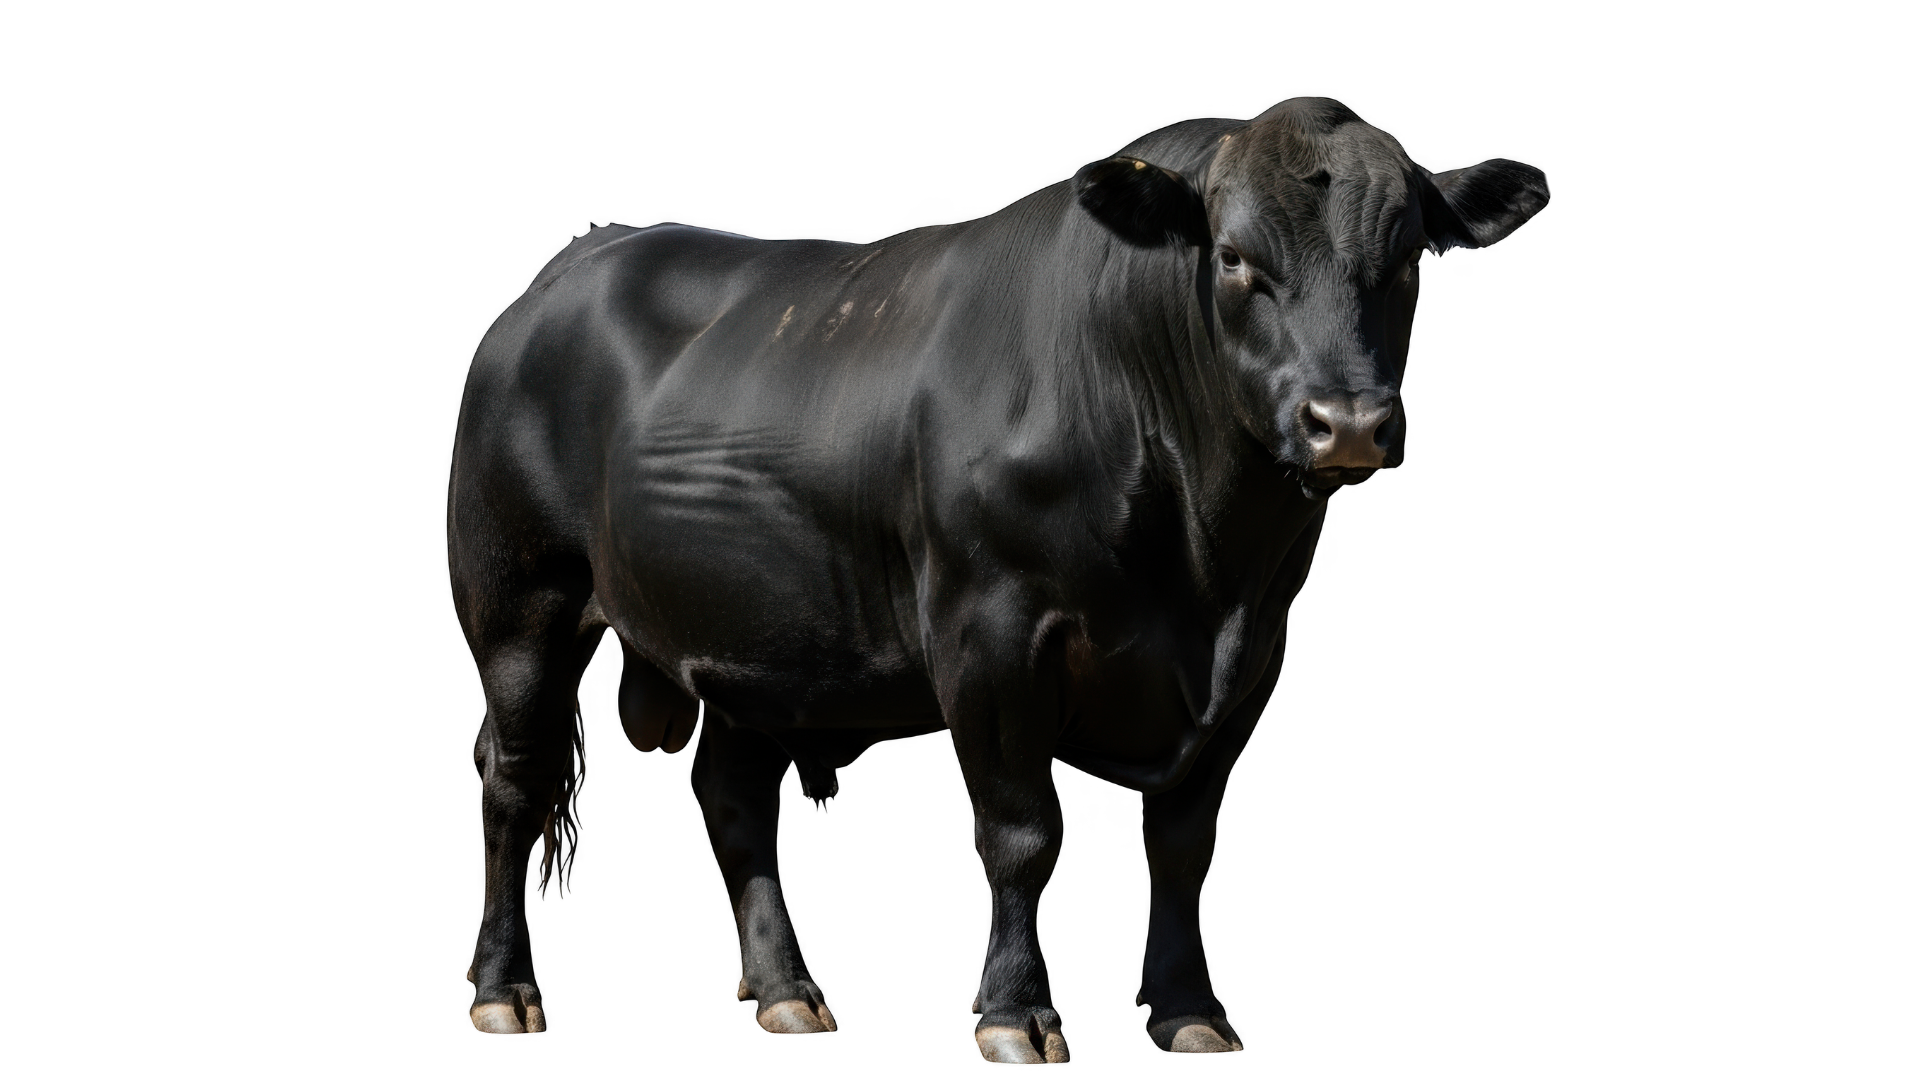
Meet ANM430 — the highest-performing bull in this test group. You wouldn't have known by looking at him. You wouldn't have known from his daily gain. You only know because we measured him.
Whether you're selling bulls or finishing steers, the question is the same: what's each animal actually worth? Most operations answer that with a herd average — a single number spread across forty head, a hundred head, a thousand. The average hides ANM430. It also hides the bull dragging your pen down. Every animal sold, culled, or kept on average pricing is value left on the table. C-Lock can help you put that value in your pocket.
$10,768 isn't a sale price. It's what his genetics save the people buying his daughters on their feed bills, every year, for the next decade.
Spread across his working life of 102 calves, with the standard 17.5% genetic pass-through to his progeny, his lifetime feed-efficiency value works out to $10,768.
The worst bull in this same pen — ANM627 — broke even at $2,575, barely above the threshold where we'd report a dollar value at all. A bull you wouldn't know to avoid just by looking at him.
ANM430 and ANM627 share the same pen, the same ration, and put on nearly the same daily gain. Side by side, you couldn't pick the winner. But under the hood they're running different engines — 430 turns feed into pounds, while 627 burns most of his ration off as heat. Same fuel, very different mileage.
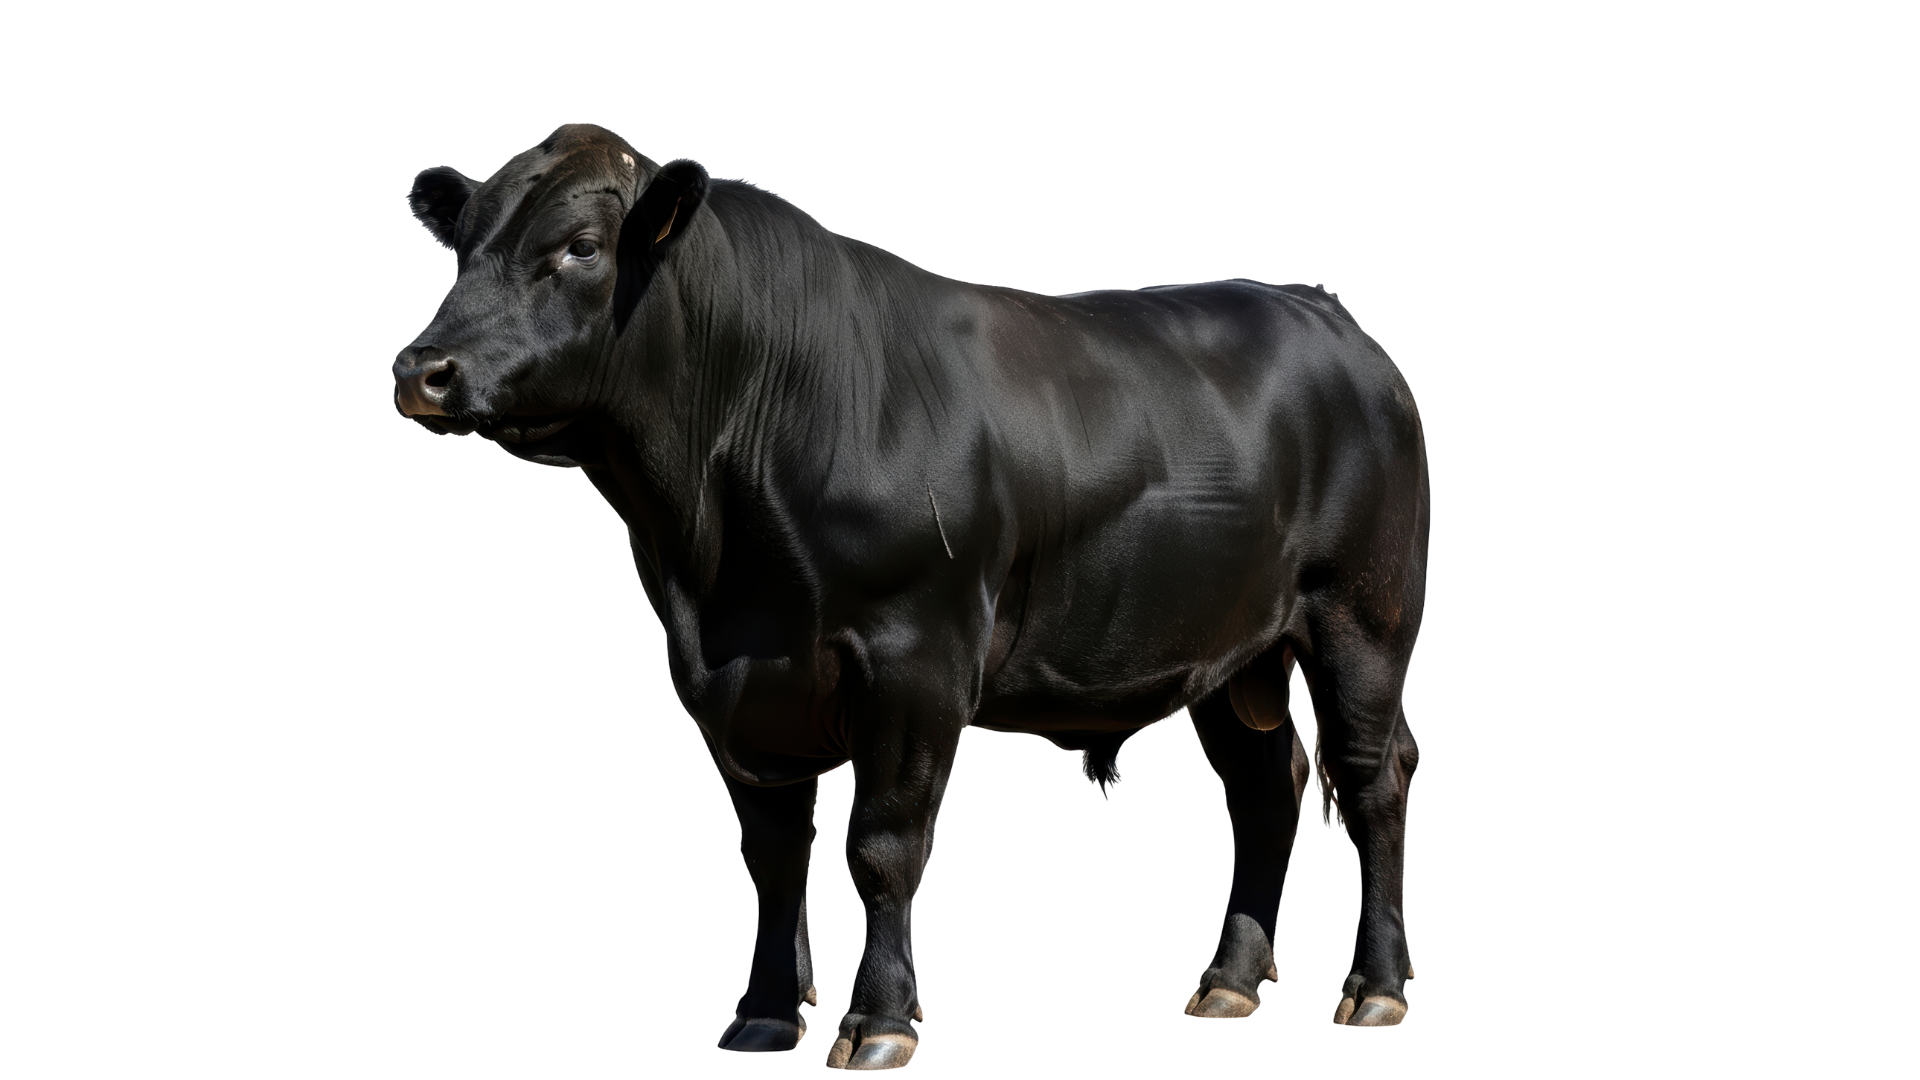
Same intake. Nearly identical daily gain on the scale. Twice the cost per pound. The difference is where the calories went — and you only see it once you measure each animal individually.
Every pen has animals making you money and animals burning through it. By eye, they look the same. Same frame, same fleshing, same pedigree on paper. But two animals on the same ration, in the same pen, for the same days can put on a pound of gain at very different costs. Without the stats on each animal, you cannot tell the profitable ones from the ones eating your margin.
That costs money both ways. Seedstock producers sell their best genetics for the same price as average ones because nothing in the sale ring shows the difference. Feedlot operators finish inefficient cattle right alongside efficient ones, paying for feed that never turns into gain.
The data is already there. It is walking your operation every day. Most producers just are not capturing it, so the most profitable animals never get identified — and the ones costing you money never get sorted out.
Efficiency doesn't mean less feed. It means more gain per dollar of feed invested. The bulls earning the highest CGI scores aren't cooler-running animals burning less fuel for maintenance — they're bulls whose appetite outpaces their maintenance bill and turns the extra feed into muscle instead of heat.
Look at ANM430 and ANM627 again. The top performer didn't eat less than the bottom performer — he ate MORE. About 1.9 Mcal per day more. And almost all of that extra intake went to tissue, not to heat. Appetite that converts is the asset.
Every bull pays his maintenance first. That's the rent. What you want is a bull who can eat enough to cover the rent and have a lot left over to build muscle. The question is — how do you find him before sale day?
CGI — the Cost of Gain Index — is a ranking system from C-Lock that puts a number on every animal in your test. Top to bottom. Best to worst. Profit drivers to profit drainers. It's built on SmartFeed and SmartScale, which measure each animal's daily feed intake and daily weight, every day of the test.
Most performance tests give you a final number on the day everyone goes home. CGI gives you the ranking while the test is still running. First estimates by Day 14. Confirmed rankings by Day 42. By sale day or shipping day, you've got a defensible number on every animal — in time to actually use it.
Two weeks of daily intake and weight data is enough to flag the early outliers — the animals already pulling ahead and the ones already drifting back.
Six weeks in, the noise is gone. CGI ranks have settled into a defensible number on every animal in the test, top to bottom.
Walk into the sale ring or onto the trailer with a CGI score on every head — in time to price bulls, sort steers, and prove what the market can't see.
You were going to weigh them anyway. CGI tells you what the weighing actually means.
One conversation is enough to know whether CGI fits your operation. We'll walk through your pens, your feeding system, and the numbers you'd see in your first 90 days.
SmartFeed, SmartScale, GreenFeed, and the rest of the SmartLine — the hardware behind every CGI score.
Talk to us about CGI on your next performance test. One conversation is enough to know whether CGI fits your operation.
See What Feed Becomes.™